One of America’s defining ideals is the idea that opportunity is available to all, regardless of where one starts on the economic ladder. The reality is that income inequality has grown dramatically since the 1970s and that increasing inequality has not been matched with growing economic mobility. Instead, the rungs on the ladder of economic advancement are being pulled further apart: in 1970, the upper-class household at the ninety-fifth percentile of income ($122,294 in 2012 constant dollars) had an income roughly three times that of the middle-class household at the fortieth percentile of income ($37,282 in 2012 constant dollars), but, by 2012, the household at the ninety-fifth percentile ($191,156) received nearly five times the income of the fortieth percentile household ($39,674).
This policy brief reviews recent scholarship from members of the Economic Disparities Research Cluster of the Haas Institute for a Fair and Inclusive Society at the University of California, Berkeley and offers important insights as well as policy-based solutions in order to meet the profound challenges of income and wealth inequality and growing poverty now facing American society.
Download Responding to Rising Inequality here.
Read a blog summarizing the brief here.
Introduction
ONE OF AMERICA’S DEFINING IDEALS is the idea that opportunity is available to all, regardless of where one starts on the economic ladder.
The reality is that income inequality has grown dramatically since the 1970s and that increasing inequality has not been matched with growing economic mobility. Instead, the rungs on the ladder of economic advancement are being pulled further apart: in 1970, the upper-class household at the ninety-fifth percentile of income ($122,294 in 2012 constant dollars) had an income roughly three times that of the middle-class household at the fortieth percentile of income ($37,282 in 2012 constant dollars), but, by 2012, the household at the ninety-fifth percentile ($191,156) received nearly five times the income of the fortieth percentile household ($39,674).1
Increasing income inequality has contributed to rising levels of residential segregation by income in large metropolitan areas.2 As highincome families share fewer neighborhoods with middle- and low-income families, the U.S. is characterized by increasingly unequal social contexts that contribute to widening disparities in educational achievements by wealth and income.3 This growing divide presents fundamental obstacles to individuals’ efforts to realize their full potential and, in turn, the nation’s ability to make the most of the potential human capital of its residents.
Given the ways in which income inequality and segregation can harm the broader society by denying each individual a fair chance to achieve his or her potential, this rise in inequality and its effects on economic mobility are increasingly recognized as a defining issues for America’s future. The Declaration of Independence proclaimed a continuing commitment to the ideal of human equality. While this ideal has often been challenged, the most significant social movements and legislative initiatives have sought to vindicate the ideal of equality of opportunity and to live up to the promises of judgments based on the contents of one’s character—not on one’s race, gender, sexual orientation, religion, physical abilities or socioeconomic background.
This policy brief reviews recent scholarship from members of the Economic Disparities Research Cluster of the Haas Institute for a Fair and Inclusive Society at the University of California, Berkeley and offers important insights as well as policy-based solutions in order to meet the profound challenges of income and wealth inequality and growing poverty now facing American society.
First, the brief assesses what is known about the dynamics of growing income inequality and its effect on the middle class. Income polarization is growing, and the middle class is shrinking. It also considers the effects of the recent recession, specifically the negative effects on already disadvantaged workers and the significant rise in the poverty rate.
Second, the brief looks at how these changing income and labor market dynamics have pushed significant portions of the middleclass toward poverty and how stagnant or declining middle-class wages hold back economic growth.
Third, the brief considers how these trends affect economic mobility for the next generation. The rungs on the ladder of economic mobility have moved further apart, but upward mobility has not kept pace. Economic mobility varies significantly across metropolitan regions—suggesting that city, state, and federal policies can have an impact.
Finally, the brief presents several policy recommendations emerging from the recent research, including raising the minimum wage, enhancing the Earned Income Tax Credit, supporting asset building, extending investments in education, and addressing residential segregation.
Accelerating Inequality
In the 1970s, the United States—like other industrialized countries—experienced significant economic restructuring shaped by technological advances, increasing global economic interconnectedness and changing political dynamics. Manufacturing employment contracted, service employment increased, labor unions experienced significant decline, and the structure of wages became more polarized, with a premium paid in the highest skilled jobs.
Since the 1970s, incomes for the highest earners have risen but the wages of the majority have stagnated or declined. The middle-class, the working-class, and the poor have received a steadily shrinking share of the national income over the past four decades, as revealed in FIGURES 1 and 2. In 2012, the 20 percent of households at the top of the income distribution received more than half of the national income (an 18 percent increase since 1970) while the 20 percent of households in the middle of the income distribution received only 14 percent of the national income (a 20 percent decrease since 1970).4 Indeed, all together the 60 percent of the population with the lowest incomes received only 26 percent of the national income in 2012 (a 19 percent decrease since 1970).5
Groundbreaking research over the past decade by UC Berkeley Economics Professor and Haas Institute Economic Disparities Cluster member Emmanuel Saez has focused national attention on this income inequality. Saez has used tax records to reveal that the share of the national income received by the top one percent of residents in the United States has more than doubled over the last thirty years, rising from 9% of the total in 1976 to more than 22.5% (including capital gains) in 2012, as illustrated in FIGURE 1.6 The average annual income for the top one percent of households in 2012 was about $1.3 million, as compared to the median household income of $51,017.7
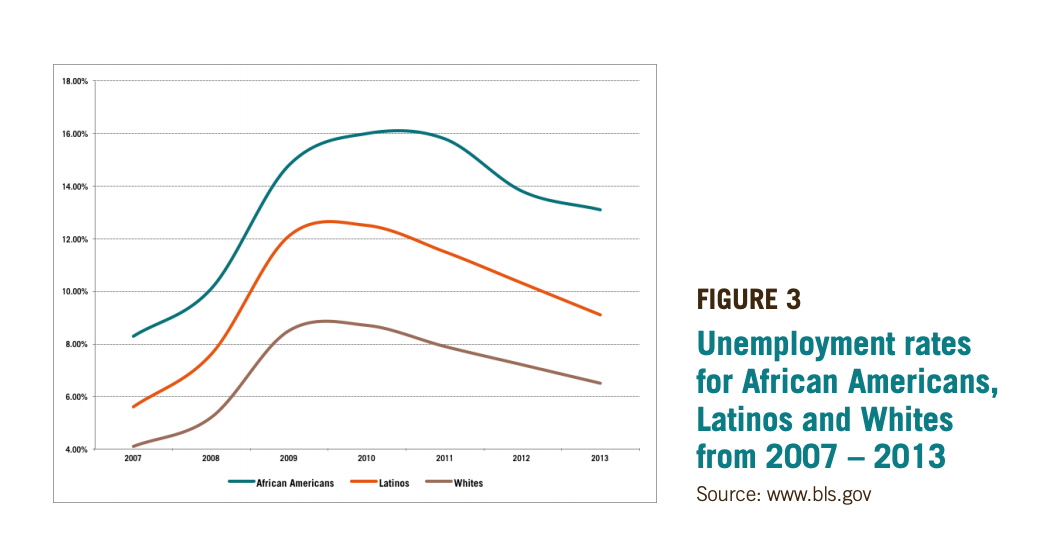
Research findings of Hilary Hoynes, Haas Institute Economic Disparities Cluster Chair and Professor of Economics and Public Policy at UC Berkeley reveal that the recent recession has only exacerbated this inequality because its effects were not evenly distributed. In terms of unemployment rates, the recession affected men more than women, African Americans and Latinos more than whites, and younger workers more than older workers (see FIGURE 3). The recession’s impact on unemployment for black men was almost double that for white men and the impact for black women was almost triple that for white women.8
Overall, declining workforce participation rates have added a significant obstacle in the path of working and middle class families’ efforts to move further up the economic ladder and have pushed many families into poverty. These challenges are reflected, for example, in an increase in the poverty rate from 12.5% in 2007 to 15.0% in 2012. More than 1 in 5 children currently live in poverty.9
KEY FINDINGS
- Economic inequality pulls the rungs on the ladder of class advancement farther apart.
- Economic mobility is highly correlated with parental income.
- Intergenerational economic mobility varies significantly by metropolitan region.
A GROWING ECONOMY BUT A SHRINKING MIDDLE CLASS
As the declining share of national income received by the bottom 60 percent of earners and the rising poverty rate demonstrate, the middle class is shrinking as households are pushed further down the income distribution. Former U.S. Labor Secretary Robert Reich, a member of the Haas Institute Economic Disparities Research Cluster and Professor of Public Policy at UC Berkeley, has highlighted the effect of the growing economic inequality on the middle class and the economy overall. Between 1990 and 2012, the proportion of households with incomes between $40,000 and $100,000 (in 2012 constant dollars) fell from 43% to 39% while the proportion of households with incomes less than $40,000 (in 2012 constant dollars) increased from 35% to 39%.10 The middle class is increasingly being pushed toward poverty, but not because the U.S. economy has failed to grow.
During the three decades following the Second World War, the United States witnessed rapid upward mobility as productivity and wages grew together and gains were relatively evenly distributed over the income scale. Since the 1980s, however, productivity has continued to grow (increasing by 78% between 1980 and 2009) yet median wages have stagnated.11 Indeed, Reich points out that in 2007 a male worker with a median wage of slightly over $45,000 earned less than a male worker with the same income level earned 30 years before (accounting for inflation, but not including fringe benefits).12 If the gains to the economy had been equally divided among Americans, Reich demonstrates, the typical person would have been 60 percent better off economically than she was in 2007.13 Where, then, did the economic gains from increased productivity go? A growing share went to the top one percent, as illustrated by FIGURE 4.
From 1993 to 2012, the incomes of the top one percent grew by 86% while the incomes of the remaining 99% grew by just 6.6% (an annual growth rate of only 0.34%). The top one percent captured over two-thirds of the overall income growth between 1993 and 2012. This disparity has only grown since the recession. Looking just at the time period since the economic recovery began in 2009, fully 95% of all of the national income gains went to the top one percent.14
Reich highlights the similarities between income inequality in 1928, just before the Great Depression, when the share of national income going to the top one percent peaked at over 23%, and income inequality in 2007, when it again peaked at over 23%, just before the recent recession, as illustrated by FIGURE 1. After 1928, the share of national income going to the top one percent declined steadily into the 1970s, when it reached about 9%, before beginning to increase again. As more income went to the very highest earners after the 1970s, the savings rate declined and the middle class took on increasing amounts of household debt (including mortgages), which rose from 55% of household income in the 1960s to 138% in 2007. Reich argues that this concentration of wealth is bad for everyone because the declining purchasing power of the middle class is limiting overall economic growth. The majority of the economy is based on consumer spending, and Reich argues that if middle class consumers don’t have the disposable income to purchase what the economy is capable of producing because that income is going to high earners who spend only a small fraction of their tremendous incomes, then the economy cannot reach its full potential.15
The polarization of the wage structure (generating more high- and low-skill jobs and fewer middle-skill jobs) has only accelerated during the recent recession and its aftermath. Although automation and international trade since the 1970s have contributed to a persistent decline in middle-skill employment, the recent recession has exacerbated this hollowing out of the middle-class. During the recession, middle-skill jobs experienced the sharpest and most lasting decline and the majority of the jobs created post recession have been in lower-skill, lower-wage occupations.16 French economist Thomas Piketty, in his book Capital in the Twenty-First Century, points out that this growing income and wealth polarization is related to the growing return to capital and the shrinking return to labor as shares of national income.
STALLED ECONOMIC MOBILITY
This growing economic inequality is of particular concern because it has the effect of pulling the rungs on the ladder of class advancement further apart, potentially affecting economic mobility. It is a longstanding pillar of faith in the United States that regardless of where one starts out, one has the opportunity to do better than one’s parents. Yet recent research by Raj Chetty, Nathaniel Hendren, Patrick Kline, Haas Institute faculty cluster member and Professor of Economics at UC Berkeley, and Emmanuel Saez finds that how much children are able to earn as adults is strongly correlated with how much their parents earned.17 While there is indeed still some mobility across classes, the majority of children retain an economic status similar to that of their parents—more than 60% of those children who grew up in families with incomes in the top fifth of income earners remain in the top two-fifths, while more than 60% of those children who grew up in families with incomes in the bottom fifth remain in the bottom two-fifths.18
One of the most surprising findings in this research is that intergenerational mobility varies substantially by metropolitan region. The probability that a child from the bottom fifth will end up in the top fifth of income earners is only 4.4% in Charlotte but nearly three times higher in San Jose—12.9%.19 A child whose parents’ earnings were in the 20th percentile ends up, on average, in the 45th percentile in Salt Lake City, but only the 35th percentile in Indianapolis.20 In short, the geographic location where one grows up matters significantly for where one ends up economically as an adult.
KEY FINDINGS
- Since 1970, the U.S. economy has grown significantly but middle class wages have remained relatively stagnant.
- A rising share of national income is going to the top one percent of earners.
- Over the past four decades, middle class households have taken on increasing amounts of debt. K
Is Inequality Inevitable?
SOME ARGUE THAT this widening gulf between the wealthiest few and the rest is inevitable.21 Broad historical and international trends suggest, however, that we have the capacity to reduce income inequality and increase economic mobility. First, incomes in the United States were much more equal from the 1940s through the 1970s, when the top one percent of earners took home roughly 9% of national income and the economy grew at a rapid pace.22 Indeed, the significant income gains of the immediate post-war period were generally equally shared across classes. Second, the fact that many other industrialized countries have not experienced the same rapid increase in inequality, yet have continued to grow economically at a similar pace, implies that national policies can make a difference. Finally, the findings with regard to the wide gaps in economic mobility across metropolitan regions indicate that local policies can also influence access to opportunity.
UC Berkeley Political Science Professor and Haas Institute Economic Disparities Research Cluster member Paul Pierson has focused his research on the role of policy in facilitating what he calls “the winner-take-all inequality” that emerged in the late 1970s. Pierson and his co-author Jacob Hacker note that the concentration of the rewards of economic growth among the very top of the economic distribution represents a significant break from the widely shared prosperity of the previous generation.23 Pierson and Hacker identify the roots of this break partially in the failure of public policy to respond to changing labor market dynamics and also to policies that facilitated financial deregulation and new corporate governance arrangements that instead contributed to the growth of income inequality. Pierson and Hacker’s research further supports the idea that the recent acceleration of income inequality is not inevitable.
Indeed, recent economic research suggests that it is possible to reduce inequality and to address poverty without significantly slowing economic growth by, among other things, increasing the minimum wage, enhancing the Earned Income Tax Credit, supporting asset building, investing in education and addressing segregation.
KEY FINDINGS
- Increasing inequality is not inevitable.
- National and regional variation in inequality and mobility imply that local, state, and federal policies can have an impact.
- Recent research indicates that minimum wage increases have not discernibly reduced employment.
- Raising the minimum wage can significantly lift the earnings of workers at the bottom of the wage structure and reduce employee turnover.
MINIMUM WAGES
One approach to reducing income inequality is to raise wages for those workers at the bottom of the distribution, the nearly 4 million workers earning the minimum wage or below.24 Congress and the White House are currently debating an increase in the federal minimum wage, but there is uncertainty about the impact any increase will have on employment rates, especially for the low-wage workers the increase is meant to help.
The primary argument against the minimumwage increase is that it may lead to losses in low-wage jobs because 1) higher wages will raise the cost to employers of producing goods and services and consumers will then reduce their consumption as prices rise, and 2) employers forced to pay higher wages will have more incentives to substitute more efficient technologies for low-wage workers. Any effects on employment rates are likely to fall disproportionately on groups already hard hit by the decline in employment during the recession. At the same time however, a higher minimum wage shifts more income to low-wage workers who generally spend a greater proportion of their earnings than higher-wage workers, potentially leading to increased demand for goods and services that could boost employment.
The most accurate way to predict what will happen if the minimum wage is increased in the future is to examine what has actually happened when minimum wages have been increased in the past. UC Berkeley Economics Professor and Haas Economic Disparities Research Cluster member Michael Reich has co-authored two articles using innovative methods to examine the effects of state minimum wage increases. Reich’s work builds on an earlier study by another UC Berkeley Economics professor and Haas Economic Disparities Research Cluster member David Card, who, together with Alan Krueger, compared the effect of changes in the minimum wage on fast food industry workers in New Jersey and Pennsylvania.25
Reich (with Arindrajit Dube and T. William Lester) analyzed the local effects on the earnings and employment of restaurant workers of all state changes to minimum wages over the sixteen years between 1990 and 2006.26 With Sylvia Allegretto, Arindrajit Dube, and Ben Zipperer, Reich extended the analysis to cover the period up to 2012 and also included an analysis of the effects on teenagers.27 The restaurant industry is the largest employer of minimum wage workers in the nation and teenagers comprise more than one-quarter of all workers earning within 10 percent of the minimum wage
The findings reveal that many existing studies overestimate the negative impact of minimum wage increases on employment levels because they do not sufficiently take into account the economic and political differences between states with relatively high versus low minimum wages. Allegretto et al. controlled for these differences by comparing the effects of a minimum wage increase across neighboring counties where one county experienced an increase in the minimum wage while the neighboring county did not.28
Allegretto et al. found no statistically significant evidence that an increase in the minimum wage reduced the growth of employment.29 What higher minimum wages did do was significantly lift the earnings of the teenagers and of restaurant workers studied. Higher minimum wages also reduced the high rates of turnover that are pervasive in low wage industries, which is beneficial for employers who waste significant resources in searching for and training new employees.
The research cannot rule out some effects on employment rates from increasing the minimum wage, even if their magnitude is significantly less than has traditionally been estimated. Increases in the minimum wage also do not significantly address the declining fortunes of the middle class, but higher wages for the lowest paid workers have the potential to lift nearly 1 million people out of poverty and add approximately $2 billion to the nation’s overall real income.30
THE EARNED INCOME TAX CREDIT
The largest federal program currently aimed at raising the incomes of working poor families in the United States is the Earned Income Tax Credit (EITC). Almost 1 out of 5 tax filers in the U.S. receive the EITC, resulting in an average credit of $2,194 in 2010. In recent years, its impact on families has lifted roughly 4.7 million children above the poverty line annually.
Extensive research by Hilary Hoynes has shown that the EITC provides critical support to families who are working but still poor and also that it significantly increases labor force participation for single parents.31 The additional income it provides to working families has been correlated with improvements in maternal and infant health and with improvements in cognitive achievement in children.32 Hoynes, together with Douglas Miller and David Simon, found that an increase of $1,000 in EITC income was correlated with a reduction of between two to three percent in the rate of low-birth weights to single mothers with a high school diploma or less. Their research found that the greater income had an impact because it increased the use of prenatal care and decreased negative health behaviors, such as smoking.
The significance of the EITC is highlighted by the fact that at least 26 states have adopted their own earned income tax credit programs to add state benefits to the federal credit. The boost that these state programs provide for low-income families matters for economic mobility. Chetty et al. find larger earned income tax credits provided by states are associated with higher levels of upward mobility at the metropolitan level.33
To receive the credit, filers must have some employment income for the year. The benefits provided increase as the filer’s earnings increase, then plateau, and then decline as earnings continue to increase. For a household of married parents with two qualifying children, the benefit increases up to a maximum credit of $5,372 for households with earned income between roughly $13,000 and $22,000 and then declines, with eligibility ending at a household income of $48,378.
Economic theory predicts that the EITC would increase employment among single parent households who are out of the workforce but that it would reduce employment for two-parent households and also reduce the hours worked by those already in the labor force. In research with Nada Eissa, Hilary Hoynes finds that the EITC does have the intended effect of encouraging individuals to enter the work force, but that it does not have the unintended but theoretically predicted effect of reducing the hours that those individuals work.34 Hoynes and Eissa find a particularly strong positive relationship between EITC and the employment rates of single women with children, implying that it meaningfully rewards their entry into the work force.
In recent work with Marianne Bitler and Elira Kuka, Hilary Hoynes extends her earlier research to investigate whether the EITC actually responds to those in economic need as that need increases by examining what happens to EITC participation during a recession.35 Taking advantage of the differences among states in both the timing and severity of recent economic downturns, Hoynes finds that the EITC significantly reduces the effect of an increase in unemployment on the increase in the poverty rate for two-parent households (a one percent increase in unemployment leads to a six percent increase in two-parent EITC filers) but has only minimal effects for single parent households.
Although it is not well suited to aid single parent households that experience losses in employment during recessions, the EITC is a critical program for raising the incomes of working families and especially for encouraging labor force participation by single parent households. Together, Hoynes’s research demonstrates the significant social benefits that the EITC creates, including improvements in household incomes, workforce participation, and infant health, among others, and suggests that expansion and augmentation of the EITC could expand its impact.
KEY FINDINGS
- Increases in the EITC can pull children out of poverty and improve health outcomes, such as low birth weights.
- The EITC has provided important economic support to low-income households, especially to single parents entering the workforce.
- During economic downturns, the EITC provides some income replacement to two-parent households where one parent is laid off but has only minimal effects for single parent households.
BUILDING ASSETS
As the significant impacts of the EITC on children’s health and academic achievement imply, economic security is a basic building block of general well-being. Savings and assets are essential to make the most of educational opportunities, to make entrepreneurialism successful, to protect families in case of unemployment or illness, and to pay for retirement.
During the recent recession from 2007 to 2010, however, family median net worth fell by 39% and the largest decreases in proportional terms occurred among those below the 75th percentile of the net worth distribution.36 Because of the financial crises households faced, the proportion of families reporting that they had saved in the preceding year fell from 56.4 percent to 52.0 percent between 2007 and 2010—the lowest level since the federal government began collecting this data in 1992.37 The proportion of income that households are saving also fell to historic lows during the recession and has remained low.
Essential to any efforts to build working and middle class wealth, therefore, are policies that encourage higher savings rates and that lower the costs of wealth building for working and middle class households. Although there are currently some limited savings incentives in place, such as the ability to deduct contributions to qualified retirement plans and the ability to deduct mortgage interest, those incentives often do not benefit individuals in the lower income brackets who do not have the financial resources to take advantage of them.
Instead of structuring savings incentives as tax deductions that depend on households having sufficient tax liabilities in order to benefit, savings incentives should be structured as refundable tax credits which treat every dollar saved equally and which actually provide equal benefits to lower income households. In addition, new programs that create a saving credit or a federal match for retirement savings accounts could encourage asset building among lower income households and help build wealth.38
Research in behavioral economics suggests that one effective way to support asset building is to use norms and inertia to support wealth creation instead of impeding it.39 For instance, studies have shown that when enrollment is the default and employees have to opt out of retirement accounts, rather than opt in to them, participation is predictably higher. When Congress passed the Pension Protection Act to encourage private employers to shift retirement accounts to an opt out system, participation in, and contributions to, those retirement accounts increased. For “passive savers,” who are generally younger and lower income, this shift means significantly more savings. Federal, state, and local policy could do more to make the most of this behavioral economics research to structure the “choice architecture” in ways that support asset building among lower income households.
While policies supporting savings are necessary, policies reducing the high-costs of financial services and of credit can also help support wealth creation for lower income households. Households have increasingly bridged the growing divide between stagnant or declining household incomes and rising expenses by taking on higher levels of debt. But research suggests that households of color and lower income households often receive higher cost, lower value financial products in what has been termed a “two-tiered” financial services structure. The high rates and fees for loans have often pushed those trying to join the middle-class backwards instead into financial distress. Government can help by increasing consumer protections in the financial sector, especially the “shadow” non-bank financial sector that is most likely to target unsophisticated clients for deceptive sales pitches and exploitative credit. The centralization of much of this oversight in the Consumer Financial Protection Bureau is an excellent first step, and further work by the CFPB and state and local governments can help lower income households from being trapped in financial marginality and instead support asset building and opportunity.
Despite the tremendous losses incurred by lower and middle class households because of the foreclosure crisis, housing remains an important avenue for asset building and government action is essential to ensuring that lower income households and communities of color have access to mortgage loans on fair terms.
The foreclosure crisis has put pressure on the government to reform its role in housing finance in such a way that it continues to provide liquidity but simultaneously minimizes risks to taxpayers. Government reform of the housing finance market, including the proposals to wind down the GSE’s Fannie Mae and Freddie Mac, would have negative consequences not just for marginalized communities and families starved of credit by redlining, and subsequently targeted by subprime lenders for reverse redlining, but also for all American families seeking entry to the middle class and to homeownership. That is not to say that homeownership for all Americans should be a policy goal, but government policies that ensure that mortgages remain broadly accessible are crucial.
An explicit government guarantee through the FHA, potentially combined with a fee to create a reserve fund to cover potential losses, and limits on the types of mortgages and securities that are guaranteed (ones that are transparent, understood by borrowers, and underwritten in accordance with relevant guidelines) can play a crucial role in ensuring stable, transparent, long-term home mortgage financing at a reasonable cost.40
Government oversight is necessary to ensure stability in housing markets and to ensure broad access to home financing for creditworthy borrowers, including those seeking small loans and those seeking loans from areas outside of highly-serviced urban and suburban neighborhoods.
INVESTMENTS IN EDUCATION
Research on numerous fronts reinforces established findings regarding the significance of educational quality for future economic opportunity and mobility. Recent studies by UC Berkeley Public Policy Professor and Haas Economic Disparities Cluster member Rucker Johnson confirm that differences in early education and school quality are among the most important components of the persistence in income disparities across generations.41 Johnson has also found that earlychildhood educational interventions, such as Head Start or universal pre-kindergarten, have significant beneficial effects on educational attainment and earnings.42 The positive effects of these interventions are magnified when spending on those programs is higher and when children subsequently attend schools with higher per-pupil spending during their adolescent years.43
These findings are supported by those of Chetty et al. showing that areas with higher mean test scores in math and English from grades 3-8 (after controlling for income levels) and lower high-school dropout rates were highly correlated with economic mobility.44 The findings regarding school quality make sense especially because differences in intergenerational mobility appear to emerge early in life, well before children actually enter the labor market. The findings are also consistent with earlier work by Chetty and others that has found that kindergarten test scores are highly correlated with college attendance, home ownership, retirement savings, and later earnings.45 In short, investments in education, beginning in early-childhood, can increase economic mobility, contribute to increased productivity, and decrease economic inequality.
TAX REFORM
Saez, together with Facundo Alvaredo, Anthony Atkinson, and Thomas Piketty,46 has noted that as the share of income going to the top one percent of earners has increased, the top income tax rates have declined. The federal income tax rates for the very highest earners fell from 70% or greater between 1936 and 1981 to 39.6% today for the top income category. It is commonly argued that lower tax rates lead to economic growth, based on the idea that lower levels of taxation for the highest earners spur more work and greater entrepreneurship.47 Comparing growth rates among countries in the Organization for Economic Cooperation and Development, Alvaredo and his co-authors argue that there is no correlation between cuts in the top tax rates and growth in real per capita GDP.48 Between the late 1970s and the beginning of the recession, countries such as the U.S. or the U.K. that cut top tax rates dramatically have not grown significantly faster than countries that did not reduce their top tax rate, such as Germany or Denmark.
Indeed, Alvaredo et al.suggest that lower top tax rates did not make top income earners more productive but instead increased their incentives to bargain for higher compensation. American chief executives have reaped salaries that are multiples higher than their counterparts at companies in similar sectors and of comparable sizes in continental Europe, where top tax rates have remained largely unchanged.49 Piketty, Saez, and Stantcheva suggest accordingly that the top tax rate could be higher (and also potentially have a higher income threshold), providing more resources for investment in education and other priorities, without negatively affecting economic growth or productivity.50
While Saez and his coauthors have revealed new information about rising income inequality, Piketty and Saez have also conducted recent research focused on wealth inequality and its implications for tax policy.51 To address limitations in the prevailing economic models of capital taxation (specifically those models’ assumptions of no inheritance and of perfect capital markets), Piketty and Saez developed an economic model that takes into account differences both in labor income and in bequests. They argue that the optimal estate tax rate depends on the flow of bequests as a percentage of national income, but that with the high value of bequests in contemporary U.S. society, the optimal estate tax rate is somewhere between 50 and 60 percent. They also argue for higher taxation rates on capital gains, suggesting that in a context of uncertainty about future returns to capital, the optimal lifetime capital tax rate should be higher than the optimal labor and bequest tax rates. A lower capital gains tax rate privileges income from capital over income from labor, and exacerbates wealth inequality by subsidizing wealth accumulation and greater wealth inequality
RESIDENTIAL SEGREGATION
In analyzing the economic mobility data, Chetty et al. found that higher levels of racial residential segregation within a metropolitan region were strongly correlated with significantly reduced levels of intergenerational upward mobility for all residents of that zone.52 Segregation by income, particularly the isolation of low-income households, was also correlated with significantly reduced levels of upward mobility. These findings are especially worrisome given that growing income inequality is contributing to increasing levels of segregation by income and the continuing concentration of poverty.53
It is not the average income of a geographical region that matters—children in the commuting zones with the lowest mean incomes (around $21,900) reach the same percentile of the national income distribution at the same rate as those in the commuting zones with the highest incomes (around $47,600). What matters for the mobility of all residents of the metropolitan region is the level of economic and racial segregation within that region. Building on the insight that enduring neighborhood inequalities create a “durable spatial logic that mediates social life,”54 these findings indicate that residential segregation is a crucial mechanism in the reproduction of inequality.55
These findings regarding the correlation between segregation and diminished economic mobility highlight the significance of local and national efforts to support inclusionary and fair housing enforcement, to invest in fostering greater opportunity in low-income neighborhoods, and to provide more pathways for housing mobility.
Currently, the largest federal investment in housing is made through the mortgage interest tax deduction, which the Office of Management and the Budget estimated would cost the U.S. Treasury $101 billion in fiscal year 2013. The mortgage interest deduction disproportionately benefits the wealthy. It allows for the deduction of all interest paid on principal of roughly $1 million or less, regardless of whether the loan is for a primary residence or a vacation home. And the deduction is regressive—borrowers of larger mortgages save more because they pay more in interest and those in higher tax brackets save more because each dollar deducted is worth more, since it is taxed at a higher rate. In 2011, only 22 percent of tax filers claimed the mortgage interest deduction and more than three-quarters of the total benefits went to the top 55 percent of those taxpayers who did claim the deduction. In short, the current structure of the mortgage interest deduction subsidizes inequality.
A more targeted program that limits deductions or credits to the interest on a primary residence and caps the eligible principal amount based on a percentage of the local housing market’s median loan value could save federal resources. This would encourage homeownership for aspiring homeowners and middle class households who actually need federal support. Lowering the maximum principal eligible for the interest deduction would also reduce incentives for buying increasingly expensive houses which exacerbates income segregation and disproportionately subsidizes larger mortgages.
The savings from a more targeted interest deduction program could be invested in policies that foster greater housing mobility, such as housing choice vouchers paired with housing counseling, and policies that reduce disparities in access to community assets, such as investments in local schools and civic institutions.
Conclusion
After reaching a high point in 1928, income inequality declined from the 1930s until the 1970s while the economy grew. Through this period of economic growth there was support for government investment in programs like the New Deal and the G.I. Bill that were designed to create a safety net and to invest in educational and residential opportunities.56
Income inequality has now reached levels not seen since the 1920s.57 Recent research suggests that policies such as investments in education and efforts to address the racially and economically segregated structure of U.S. metropolitan areas could decrease inequality and increase economic mobility. Higher minimum wages and enhanced EITC, although addressing poverty most directly, also have the potential to affect inequality and mobility. Saez and Piketty have suggested that inheritance taxes and more progressive taxation of the highest earners could simultaneously reduce economic inequality and provide resources to support greater social mobility, for instance by investing in education or in income supports such as the EITC.
Policymakers must be attentive to the impacts that universal approaches, such as these, can have on differently situated groups because these policies could unintentionally exacerbate existing disparities. Policies such as minimum age increases or enhancing the EITC do little to help the long-term unemployed or families without able-bodied workers.
Nevertheless, each of these policies, if carefully implemented, has the potential to lift working households out of poverty, support greater economic mobility, or reduce the growth of income inequality. The interrelatedness of these issues means that a strategy of focusing on both poverty and inequality is important, recognizing that, although related, poverty and inequality are not the same. To understand the impacts of such policies going forward requires disaggregating information on different populations and geographic areas, especially because the existing research has identified wide variations among each.
While this policy brief is primarily focused on income inequality, it is also important to address the related issue of wealth inequality, which contributes to income inequality through the inter-generational transmission of economic and human capital.58
To highlight the growth of wealth inequality occurring directly through the intergenerational transmission of larger and larger sums of financial capital (as opposed to the wealth advantages that accrue from unequal social connections and educational opportunities), Piketty has proposed the institution of a global tax on wealth to overcome the danger of capital flight. The proposal has been critiqued as impractical and Piketty has acknowledged it is “utopian,” while defending the effort to focus attention on the growing concentration of capital.
All of these policies could be enacted at local, state, and federal levels—if there is the political will. On the one hand, increasing concentration of income and wealth buys greater influence and access, making inequality more difficult to challenge as that income can be used to influence the perception of its fairness, through the media, and efforts to address it, through lobbying.59 On the other hand, the widening gulf between the top one percent and the remaining 99 creates momentum for creative policies that can bring together broad constituencies to address the structures that continue to pull us apart.
Between 2009 and 2012, 95% of all national income gains went to the very top one percent of earners. Extreme concentrations of income and wealth pose fundamental challenges to America’s ideals of democracy and equal opportunity, but are not inevitable.
Recommendations
Increase the Minimum Wage
- Research indicates that minimum wage increases have not discernibly reduced employment.
- An increase in the minimum wage could lift nearly 1 million Americans out of poverty
Augment and Improve the Earned Income Tax Credit
- Receipt of the EITC is correlated with improvements in maternal and infant health and cognitive achievement in children, as well as improved economic mobility.
- Expansion and improvement of the EITC could better support working families.
Tax Reform
- Raise marginal income tax rates on the highest earners.
- Adjust capital gains tax rates so that they are commensurate with income tax rates.
- Raise top federal estate tax rates to their pre-2002 rates to inhibit intergenerational wealth inequality.
Invest in Education
- Early-childhood educational interventions, such as Head Start, have significant beneficial effects on educational attainment and earnings.
- Areas with higher mean test scores and lower high-school dropout rates have higher rates of economic mobility.
Build Assets and Wealth for Lower and Middle Income Americans
- Shift savings incentives from tax deductions that disproportionately benefit the wealthy into refundable tax credits that provide more equal benefits across income categories.
- Create new incentives for saving, such as a savings credit or a federal match for retirement accounts, in order to encourage asset building and facilitate wealth creation among lower and middle income households.
- The government should continue to provide housing and credit on affordable terms to advance the opportunity for homeownership as government policy. Rather than wind down Fannie Mae and Freddie Mac, these government sponsored entities should continue to serve their purpose creating liquidity in the mortgage market.
Support Economic and Racial Integration in Neighborhoods and Schools
- 1U.S. Census Bureau 2014a, Current Population Survey, Annual Social and Economic Supplements, Historical Income Table H-1. Available at: https://www.census.gov/hhes/www/income/data/historical/household/.
- 2Reardon, Sean and Kendra Bischoff. 2011. “Income Inequality and Income Segregation.” American Journal of Sociology. 116(4): 1092-1153; Reardon, Sean and Kendra Bischoff. 2011. Growth in the Residential Segregation of Families by Income, 1970-2009. US2010 Project Report. Providence, RI: Brown University
- 3Reardon, Sean. 2013. The Widening Income Achievement Gap. Educational Leadership 70(8): 10-16.
- 4U.S. Census Bureau 2014b, Current Population Survey, Annual Social and Economic Supplements, Historical Income Table H-2. Available at: https://www.census.gov/hhes/www/income/data/historical/household/.
- 5Id
- 6Alvaredo, Facundo, Anthony Atkinson, Thomas Piketty, and Emmanuel Saez. 2013. “The Top 1 Percent in International and Historical Perspective.” Journal of Economic Perspectives, 27(3): 3-20.
- 7Id.; U.S. Census Bureau 2014c, Current Population Survey, Annual Social and Economic Supplements, Historical Income Table H-8. Available at: https://www.census.gov/hhes/www/income/data/historical/household/.
- 8Hoynes, Hilary, Douglas Miller, and Jessamyn Schaller. 2012. “Who Suffers during Recessions?” Journal of Economic Perspectives, 26(3): 27-48.
- 9U.S. Census. 2012. People in Poverty by Selected Characteristics: 2011 and 2012. Available at: http://www.census.gov/hhes/www/poverty/data/incpovhlth/2012/tables.html.
- 10NYU Furman Center. 2014. The State of New York City’s Housing and Neighborhoods. Available at: http://furmancenter.org/research/sonychan.
- 11Levy, Frank and Thomas Kochan. 2012. “Addressing the Problem of Stagnant Wages.” Comparative Economic Studies 54: 739–764.
- 12Reich, Robert. 2010. Aftershock: The Next Economy and America’s Future. New York: Alfred A. Knopf.
- 13Id.
- 14Saez, Emmanuel. 2013. Striking it Richer: The Evolution of Top Incomes in the United States. Available at: http://elsa.berkeley.edu/~saez/saezUStopincomes-2012.pdf
- 15Reich, Robert. 2010. Aftershock: The Next Economy and America’s Future. New York: Alfred A. Knopf.
- 16Foote, Christopher L. and Richard W. Ryan. 2014. Labor-Market Polarization Over the Business Cycle. Prepared for 2014 NBER Macroeconomics Annual Conference.
- 17Chetty, Raj, Nathaniel Hendren, Patrick Kline, and Emmanuel Saez. 2014. “Where is the Land of Opportunity? The Geography of Intergenerational Mobility in the United States,” NBER Working Papers 19843, National Bureau of Economic Research, Inc.
- 18Id.
- 19Id.
- 20Id.
- 21e.g. Cowen, Tyler. 2013. Average Is Over: Powering America Beyond the Age of the Great Stagnation. New York: Dutton.
- 22Alvaredo, Facundo, Anthony Atkinson, Thomas Piketty, and Emmanuel Saez. 2013. “The Top 1 Percent in International and Historical Perspective.” Journal of Economic Perspectives, 27(3): 3-20.
- 23Hacker, Jacob and Paul Pierson. 2010. Winner-TakeAll Politics: How Washington Made the Rich Richer—and Turned Its Back on the Middle Class. New York: Simon and Schuster.
- 25Card, David and Alan Krueger. 1994. “Minimum Wages and Employment: A Case Study of the Fast Food Industry in New Jersey and Pennsylvania.” American Economic Review 84(4): 772-793.
- 26Dube, Arindrajit, T. William Lester, and Michael Reich. 2010. Minimum Wage Effects Across State Borders: Estimates Using Contiguous Counties. The Review of Economics and Statistics 92(4):945-64.
- 27Allegretto, Sylvia and Dube, Arindrajit and Reich, Michael and Zipperer, Ben, 2013. “Credible Research Designs for Minimum Wage Studies.” IZA Discussion Paper No. 7638. Available at SSRN: http://ssrn.com/abstract=2336435
- 28Id.
- 29Id.
- 30Congressional Budget Office. 2014. The Effects of a Minimum-Wage Increase on Employment and Family Income. Available at: http://www.cbo.gov/publication/44995. Using a credible research design, Arindrajit Dube finds even larger anti-poverty effects of an increase in the minimum wage.
- 31Eissa, Nada and Hilary Hoynes, 2006. “Behavioral Responses to Taxes: Lessons from the EITC and Labor Supply.” Tax Policy and the Economy, 20: 73-110.
- 32Hoynes, Hilary, Douglas L. Miller, and David Simon. 2012. “Income, the Earned Income Tax Credit, and Infant Health,” NBER Working Papers 18206, National Bureau of Economic Research, Inc.; Dahl, Gordon and Lance Lochner. 2012. “The Impact of Family Income on Child Achievement: Evidence from the Earned Income Tax Credit,” American Economic Review, 102(5): 1927-56.
- 33Chetty, Raj, Nathaniel Hendren, Patrick Kline, and Emmanuel Saez. 2014. “Where is the Land of Opportunity? The Geography of Intergenerational Mobility in the United States,” NBER Working Papers 19843, National Bureau of Economic Research, Inc.
- 34Eissa, Nada and Hilary Hoynes, 2006. “Behavioral Responses to Taxes: Lessons from the EITC and Labor Supply.” Tax Policy and the Economy, 20: 73-110.
- 35Bitler, Marianne, Hilary Hoynes, and Elira Kuka. 2014. “Do In-Work Tax Credits Serve as a Safety Net?” NBER Working Papers 19785, National Bureau of Economic Research, Inc.
- 36Bricker, J., Kennickell, A.B., Moore, K.B., and Sabelhaus, J. 2012. “Changes in U.S. Family Finances from 2007 to 2010: Evidence from the Survey of Consumer Finances.” Federal Reserve Bulletin 98(2).
- 37Id.
- 38Weller, Christian E. & Amy Helburn, 2009. “Public Policy Options to Build Wealth for America’s Middle Class,” Working Papers wp210, Political Economy Research Institute, University of Massachusetts at Amherst.
- 39E.g. Thaler, Richard H. and Cass R. Sunstein. 2008. Nudge: Improving Decisions About Health, Wealth, and Happiness. New Haven: Yale University Press.
- 40Ellen, Ingrid Gould and Mark Willis. 2012. Comments on ‘Are the Government-Sponsored Enterprises (GSEs) Justified? Housing Police Debate 22(2): 149-152.
- 41Johnson, Rucker. 2010. “Who’s on the Bus? The Role of Schools as a Vehicle to Intergenerational Mobility.” Working paper available at: http://socrates.berkeley.edu/~ruckerj/workingpapers.html
- 42Johnson, Rucker. 2012. “School Quality and the LongRun Effects of Head Start.” Working paper available at: http://socrates.berkeley.edu/~ruckerj/workingpapers.html.
- 43Id.
- 44Chetty, Raj, Nathaniel Hendren, Patrick Kline, and Emmanuel Saez. 2014. “Where is the Land of Opportunity? The Geography of Intergenerational Mobility in the United States,” NBER Working Papers 19843, National Bureau of Economic Research, Inc
- 45Chetty, Raj, John Friedman, Nathaniel Hilger, Emmanuel Saez, Diane Whitmore Schanzenbach, and Danny Yagan. 2011. “How Does Your Kindergarten Classroom Affect Your Earnings? Evidence from Project Star.” The Quarterly Journal of Economics, 126(4): 1593-1660.; see also Card, David and Alan Krueger. 1992. “School Quality and Black-White Relative Earnings: A Direct Assessment,” The Quarterly Journal of Economics, 107(1): 151-200
- 46Alvaredo, Facundo, Anthony Atkinson, Thomas Piketty, and Emmanuel Saez. 2013. “The Top 1 Percent in International and Historical Perspective.” Journal of Economic Perspectives, 27(3): 3-20.
- 47E.g., Feldstein, Martin. 1995. “The Effect of Marginal Tax Rates on Taxable Income: A Paenl Study of the 1986 Tax Reform Act.” Journal of Political Economy 103(3): 551-72; Mankiw, N. Gregory. 2013. “Defending the One Percent.” Journal of Economic Perspectives, 27(3): 21-34.
- 48Alvaredo, Facundo, Anthony Atkinson, Thomas Piketty, and Emmanuel Saez. 2013. “The Top 1 Percent in International and Historical Perspective.” Journal of Economic Perspectives, 27(3): 3-20.
- 49Id.; see also Stiglitz, Joseph. 2012. The Price of Inequality. New York: W.W. Norton & Company, Inc.
- 50Piketty, Thomas, Emmanuel Saez, and Stefanie Stantcheva. 2011. Taxing the 1% Available at: http://www.voxeu.org/article/taxing-1-why-top-taxrate-could-be-over-80.
- 51Piketty, Thomas and Emmanuel Saez. 2012. A Theory of Optimal Capital Taxation. NBER Working Paper No. 17989.
- 52Chetty, Raj, Nathaniel Hendren, Patrick Kline, and Emmanuel Saez. 2014. “Where is the Land of Opportunity? The Geography of Intergenerational Mobility in the United States,” NBER Working Papers 19843, National Bureau of Economic Research, Inc.
- 53Reardon, Sean and Kendra Bischoff. 2011. “Income Inequality and Income Segregation.” American Journal of Sociology. 116(4): 1092- 1153; Jargowsky, Paul. 2013. Concentration of Poverty in the New Millenium: Changes in Prevalence, Composition, and Location of High-Poverty Neighborhoods. New York: The Century Foundation.
- 54Sampson, Robert. 2012. Great American City: Chicago and the Enduring Neighborhood Effect. Chicago, IL: The University of Chicago Press.
- 55Pattillo-McCoy, Mary. 1999. Black Picket Fences: Privilege and Peril among the Black Middle Class. Chicago: University of Chicago Press; Sharkey, Patrick. 2013. Stuck in Place: Urban Neighborhoods and the End of Progress Toward Racial Equality. Chicago, IL: The University of Chicago Press.
- 56At least for whites, see e.g. Ira Katznelson. 2006. When Affirmative Action Was White: An Untold History of Racial Inequality in Twentieth-Century America. New York: W.W. Norton & Co.
- 57Piketty, Thomas. 2014. Capital in the Twenty-First Century. Cambridge, MA: Harvard University Press.
- 58Piketty, Thomas. 2014. Capital in the Twenty-First Century. Cambridge, MA: Harvard University Press
- 59Alvaredo, Facundo, Anthony Atkinson, Thomas Piketty, and Emmanuel Saez. 2013. “The Top 1 Percent in International and Historical Perspective.” Journal of Economic Perspectives, 27(3): 3-20.