California is America on fast forward.
The state’s demographic changes have outpaced and foreshadowed the nation. The shifts in our racial composition between 1980 and 2000 are what the US will experience between 2000 and 2040. Moreover, the state’s widening income divides have equally led the nation. California moved from a middle-ranking among states in terms of inequality in 1969 to now the fourth most unequal state. Thankfully, we are doing something about it: Initiatives to raise the minimum wage, reduce incarceration, and make the economic lives of immigrants more viable have all taken root.
None of this is automatic or accidental. Labor, environmental, and social justice communities have shifted the political calculus enough that there is an opportunity to chart a more equitable way forward and to provide an example to the rest of the country, particularly as other states catch up to our demographic and economic changes. There is increased recognition that inequality—at its current levels—can actually erode our economy and communities. And there is growing evidence that working to achieve racial and economic equality results in stronger and more resilient economic growth in the long-run.
We are, in short, at the cusp of a new California—and one that could help define for the nation what it means to link equity and growth.
Getting on the right track means building a sustainable economy for all Californians. When a community leaves some behind, those forgotten may start to wonder who has got their back? So how do we move forward on equity? Getting the facts of the underlying conditions right is a great place to start, and our aim in this short paper.
Demographic Shifts
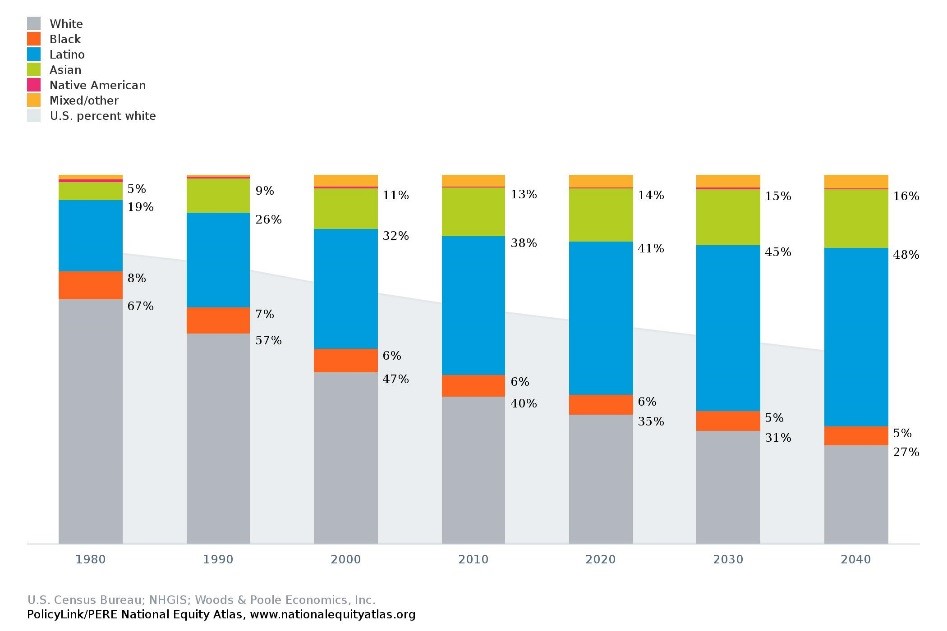
By 2040, California will be 73 percent people of color, as shown in the graph below. The most dramatic demographic change has already happened. In 1980, whites accounted for 67 percent of the population. By 2000, only 47 percent of population was white. During that same period, Latinos grew from 19 percent to 32 percent of the population. Eighty-four percent of Latinos are of Mexican origin. Another growing segment of the population are Asian American/Pacific Islander (AAPI) Californians. Of the AAPI population, 25 percent are Chinese or Taiwanese, 24 percent are Filipino, 12 percent are Vietnamese, 11 percent are Asian Indian, and 9 percent are Korean (along with smaller shares of other AAPI-origin categories).
• The shifts in race/ethnicity cannot be attributed mainly to immigrants: The share of the population that is immigrant is leveling off in the state, and actually dropping in Los Angeles.1 In California, we have a settled immigrant population – our state has the greatest share of immigrants who have been in the US since 1999. Of immigrants who have been in the county for more than 30 years, 41 percent are from Mexico, 8 percent from the Philippines, 5 percent from Vietnam, 4 percent from El Salvador, and 3 percent from Korea. Of those who arrived in the past 10 years, India (7 percent) and China (7 percent) have risen into the top five countries of origin (Mexico, 35 percent; Philippines, 9 percent; and Korea, 4 percent).2
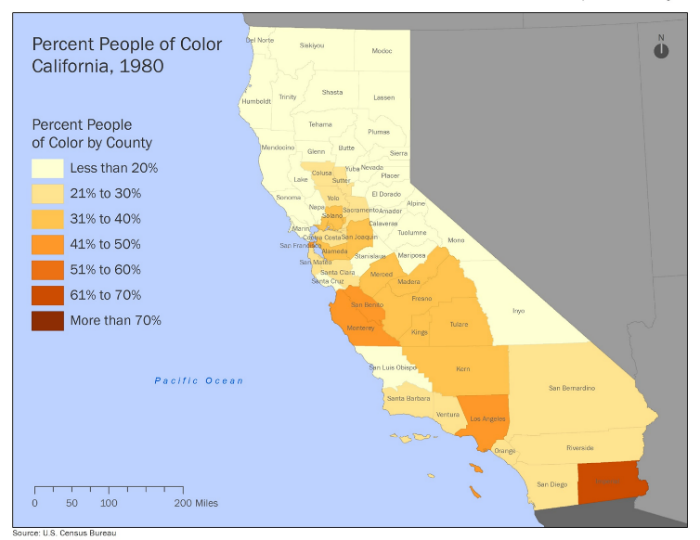
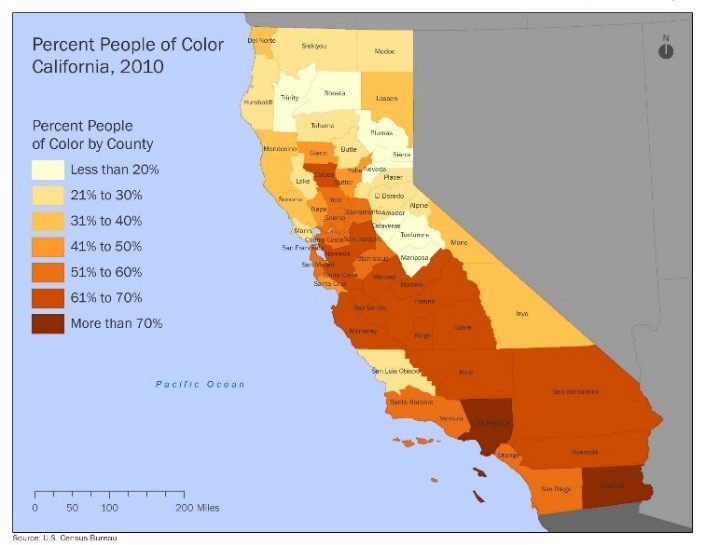
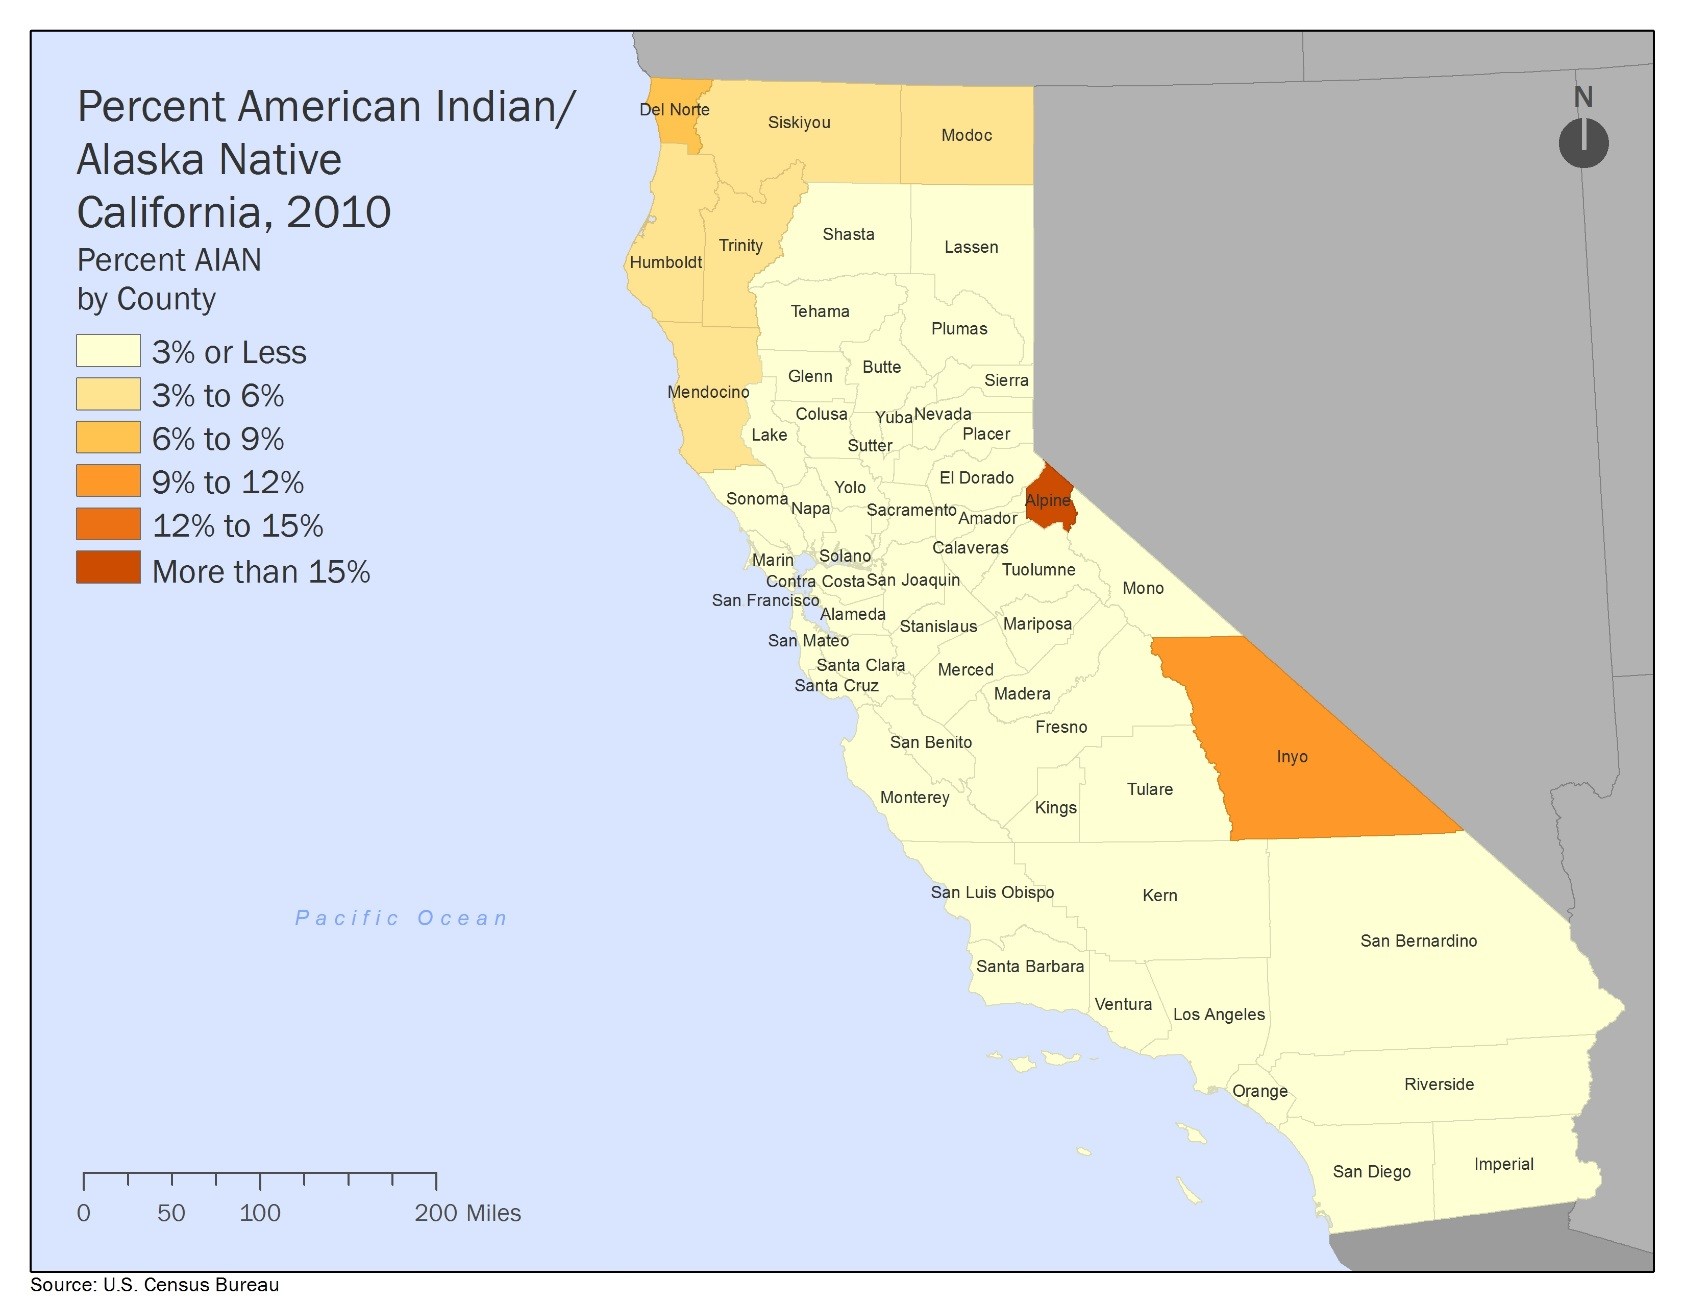
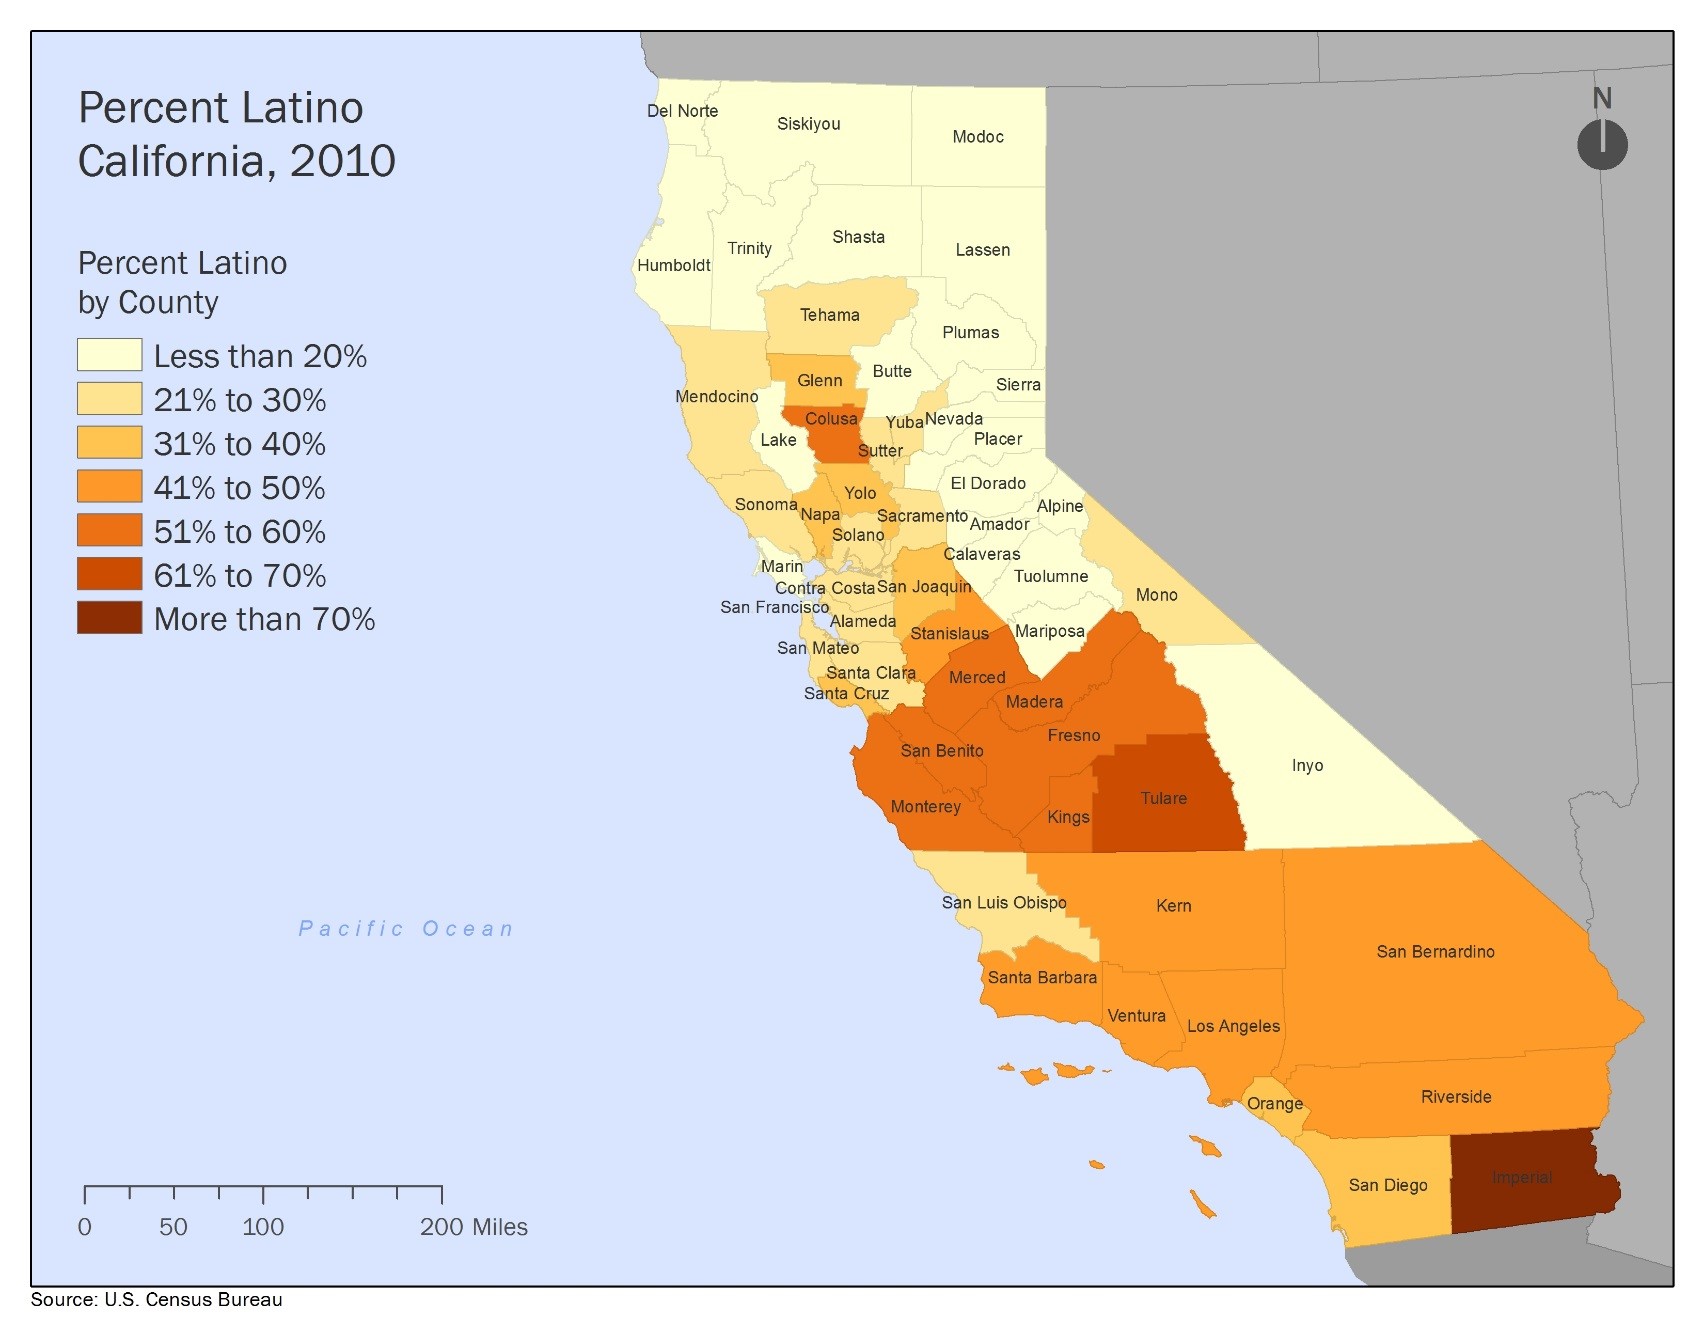
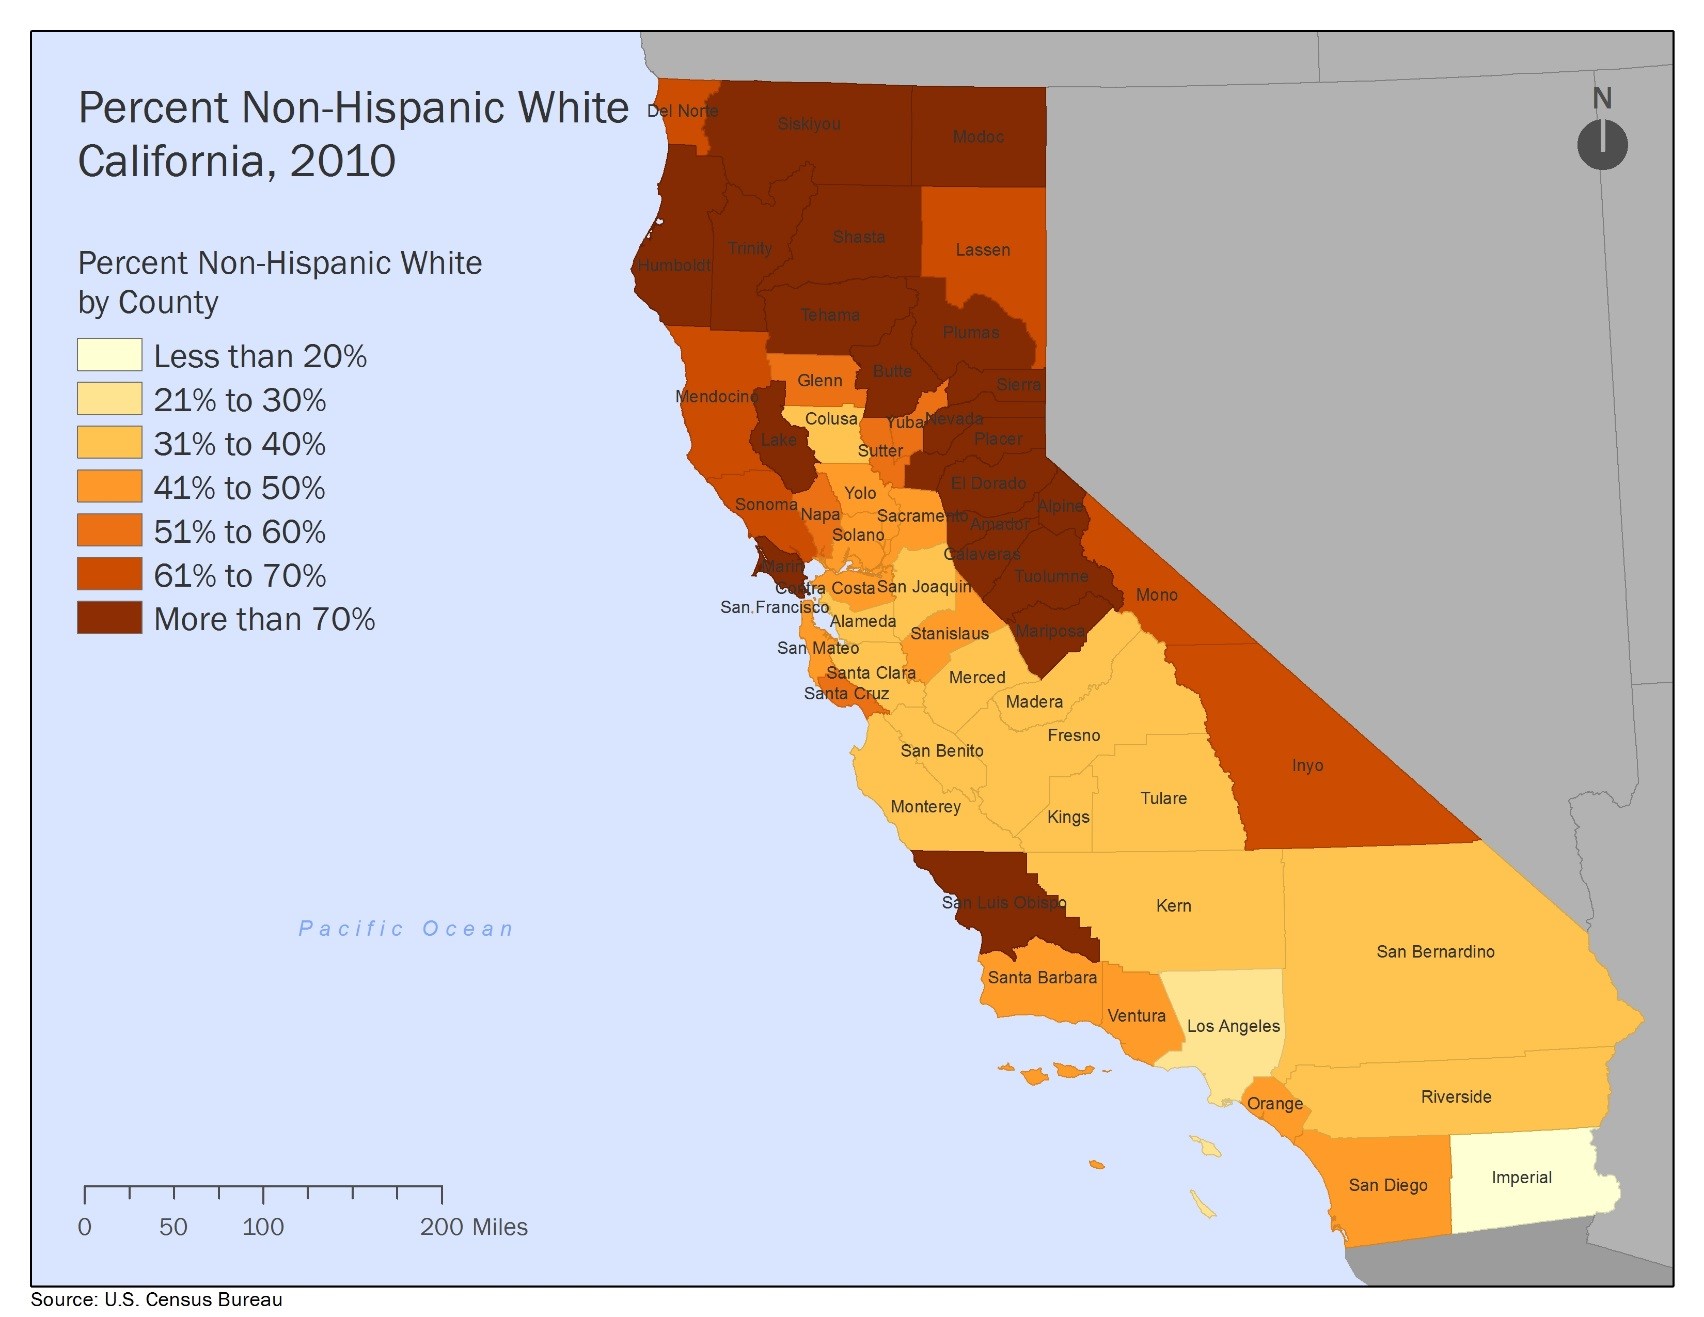
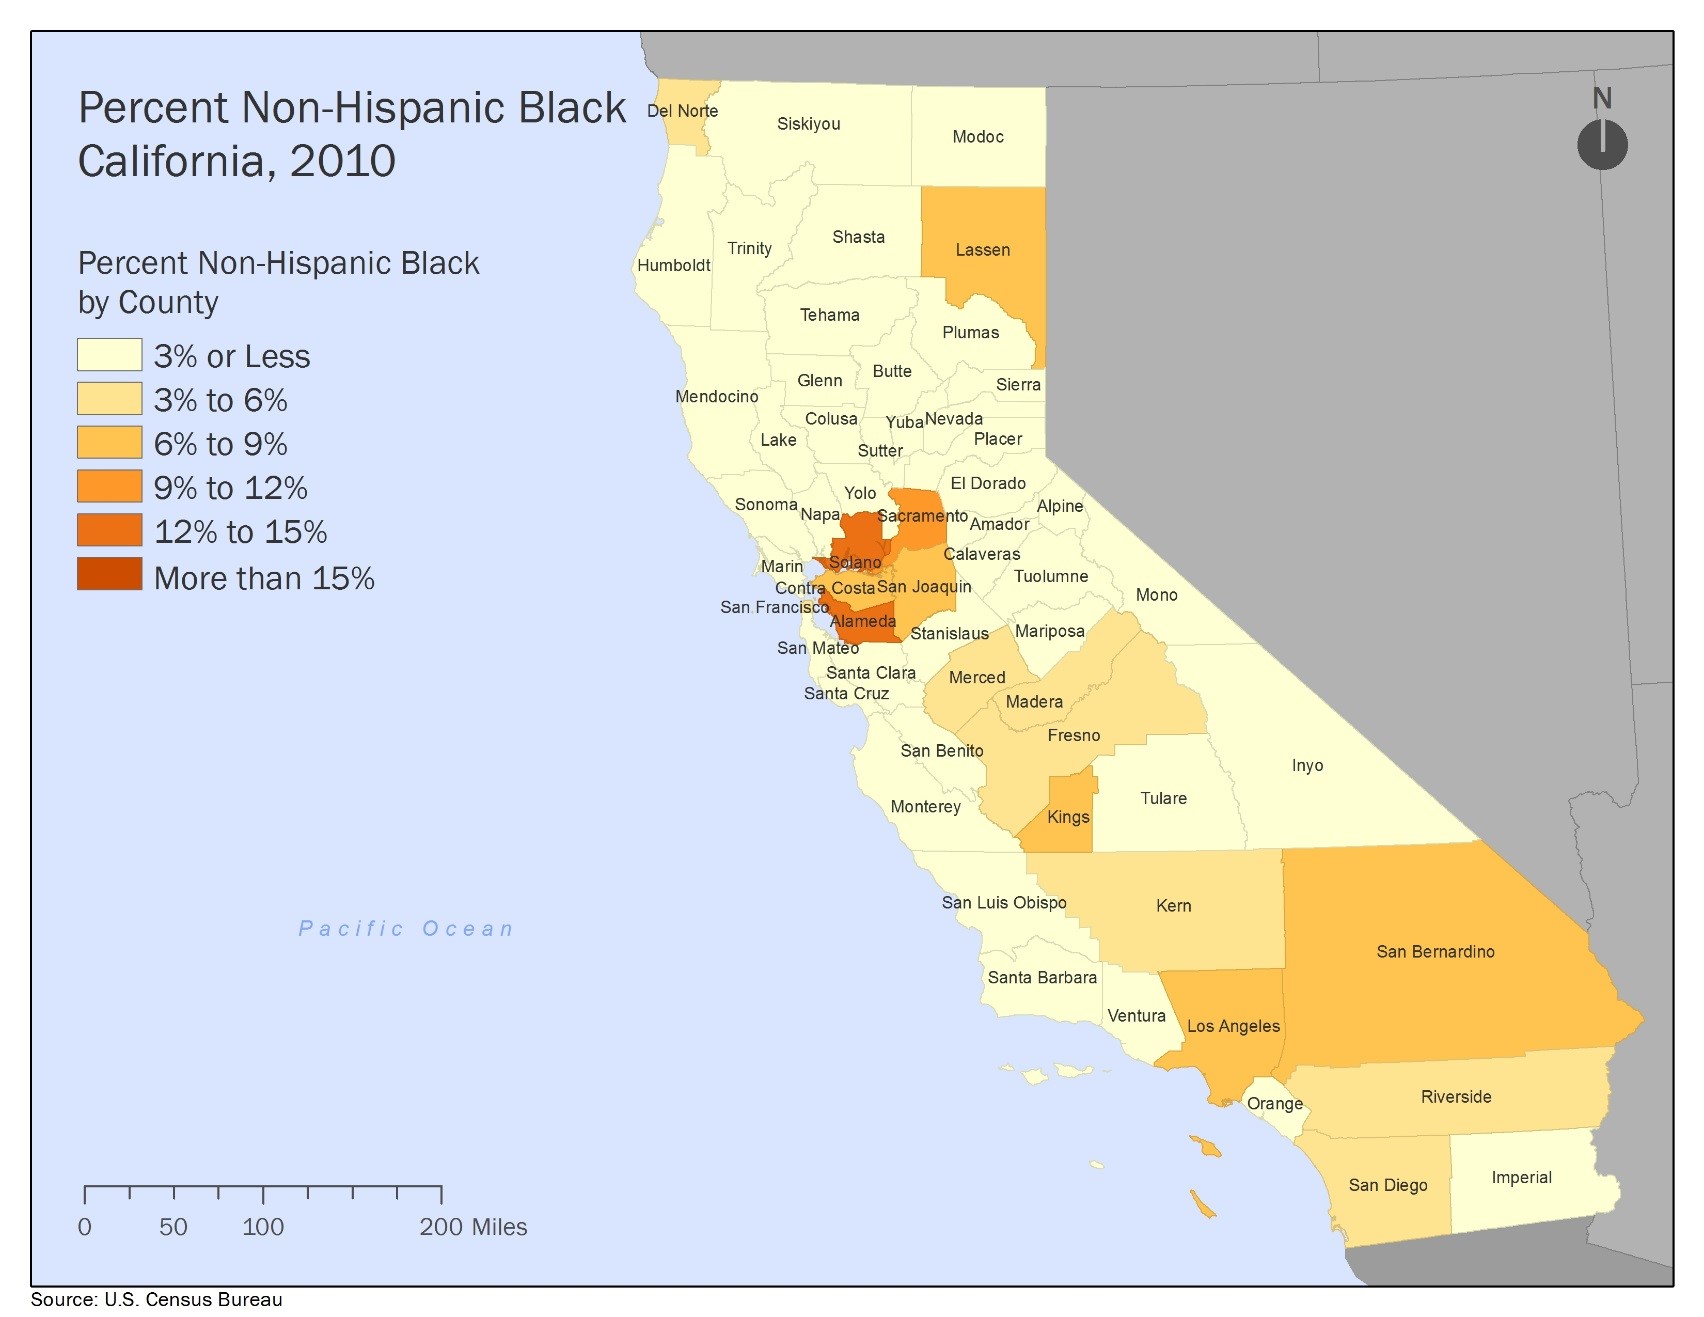
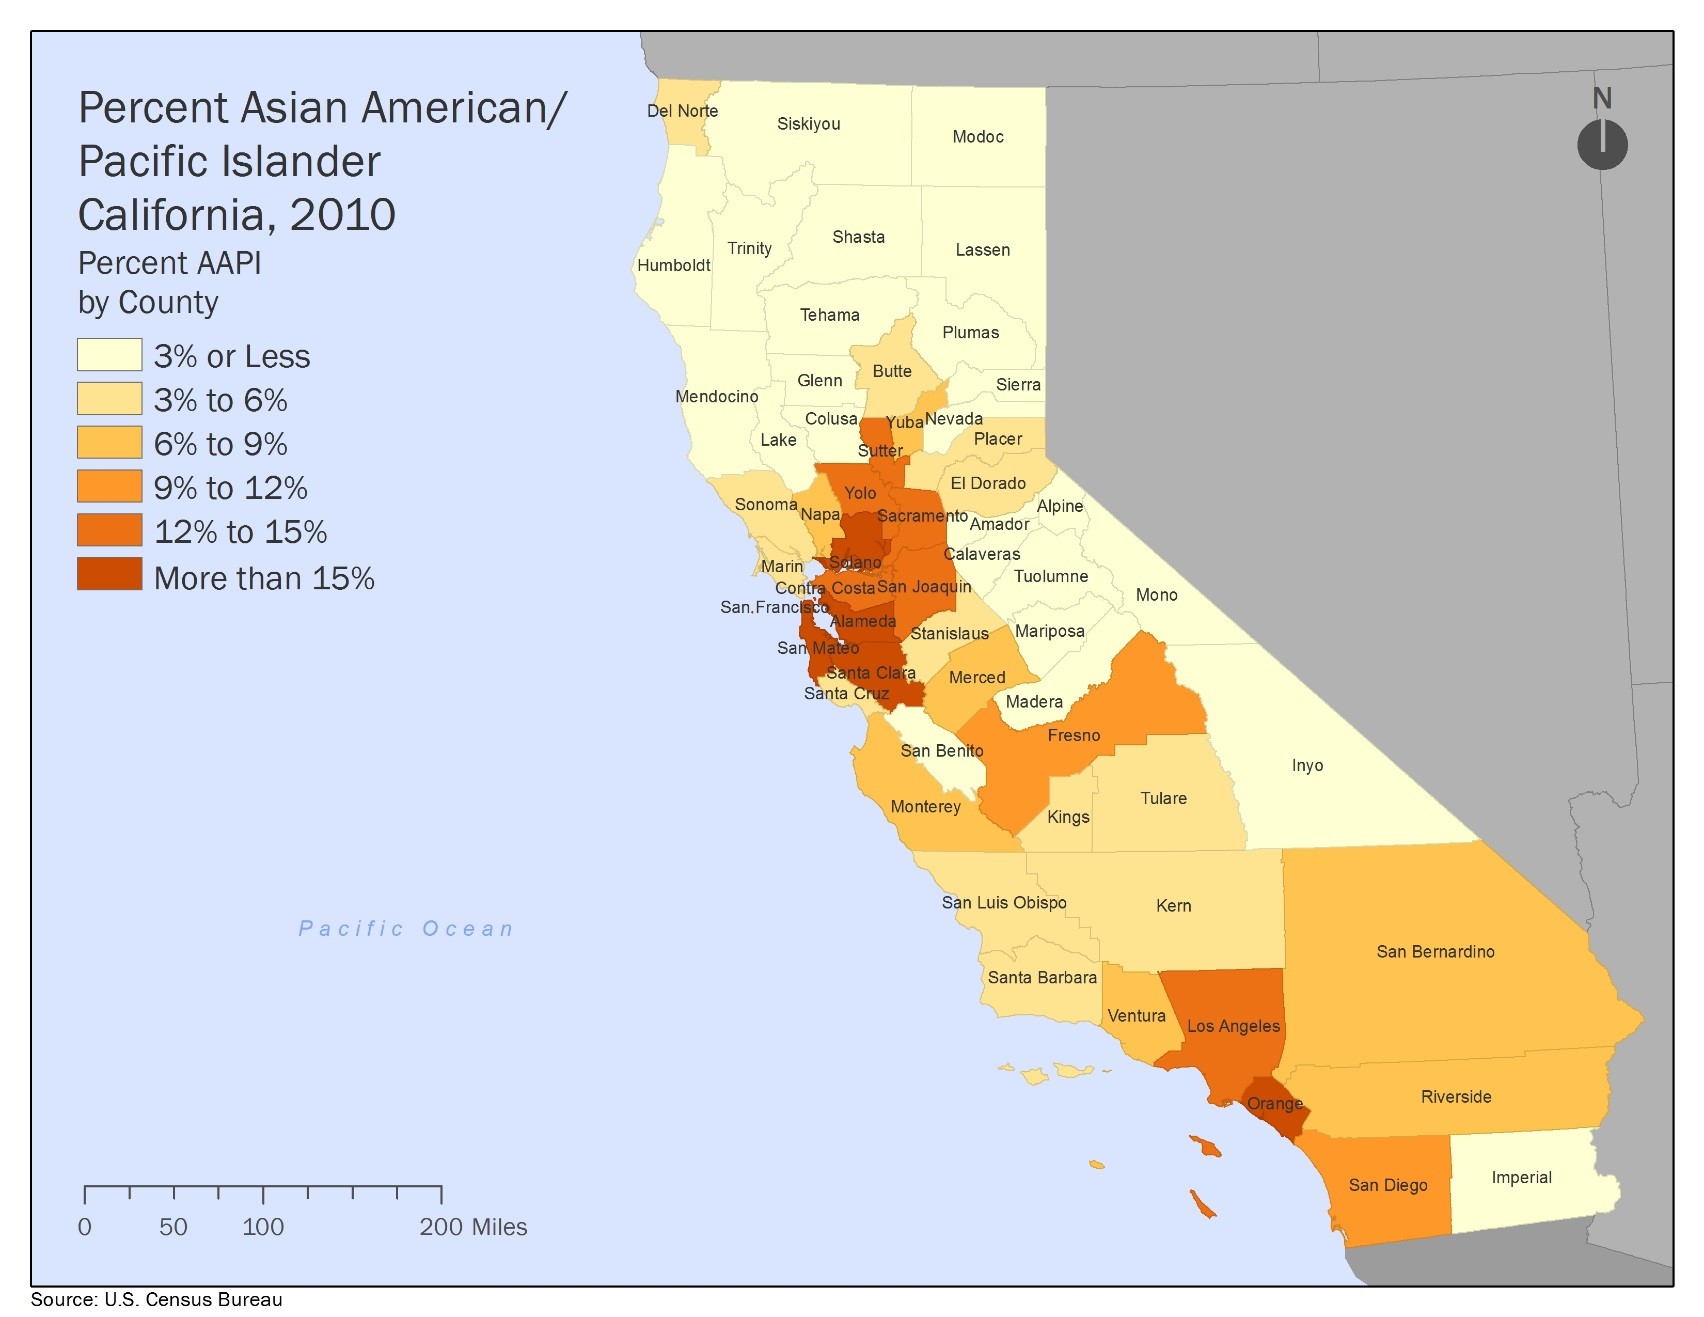
• Some places in California have changed more rapidly than others. The maps above show the change in the share of people of color by county from 1980 and 2010. The southeastern Bay Area, the Central Valley, and Southern California are ahead of the curve, with Los Angeles and Imperial counties leading. And in decades to come, these trends will continue: By 2040, 24 of our 58 counties will be more than 70 percent people of color. For maps of the geographic distribution of racial/ethnic groups across the state in 2010, see the appendix.
Increasing Inequality
California is growing in economic inequality.
As measured by the Gini coefficient, inequality in California has not only risen since 1969, but our ranking among all states has risen as well. As of 2013, our Golden State is the fourth most unequal state surpassed only by New York, Connecticut, and Louisiana. What that looks like in terms of income: The middle fifth of wage earners make as much in a year as the top 1 percent makes in a week. In 2013, the middle fifth of earners had an adjusted gross income of $37,000 whereas the top 1 percent made nearly that amount in a week (an AGI of $1,614,600 annually, or of $31,100 per week).3
Part of the inequity is due to the fact that our state’s economic gains are not translating into greater income gains for workers. California has outpaced the nation in terms of productivity—a measure of how much the economy produces per worker. Between 1979 and 2013, our productivity increased by 89.1 percent, which is 13.5 percentage points more than the national rate. Despite this boom in productivity, the percent change in median compensation to workers increased by only 2.9 percent in that same timeframe.4 While there are a variety of factors related to increased productivity, these data show little correlation between it and increased earnings in our state.
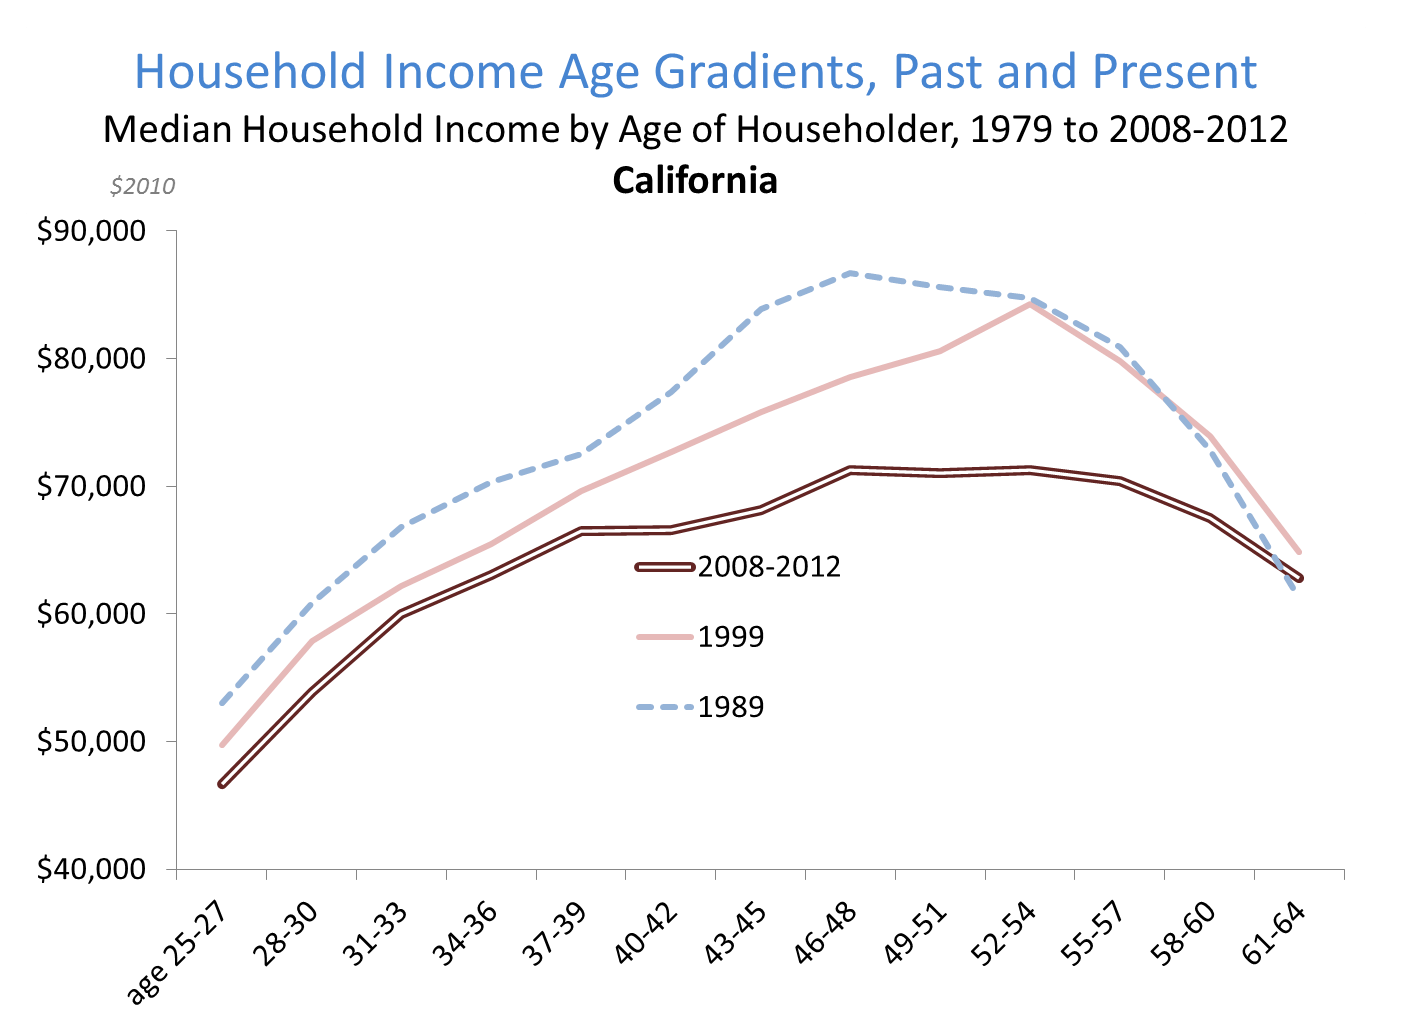
The graph below illustrates the generational differences in household income by age. At a time when income inequality was less stark, one could expect to start in the workforce with lower earnings that would increase with more work experience—with peak earnings in one’s 50s before retiring at age 64. That trajectory is significantly dampened in the current economy.
Householders of all ages are earning less than their counter-parts in earlier decades—creating an income and wealth gap such that workers can no longer afford to retire and are staying in the labor force longer.
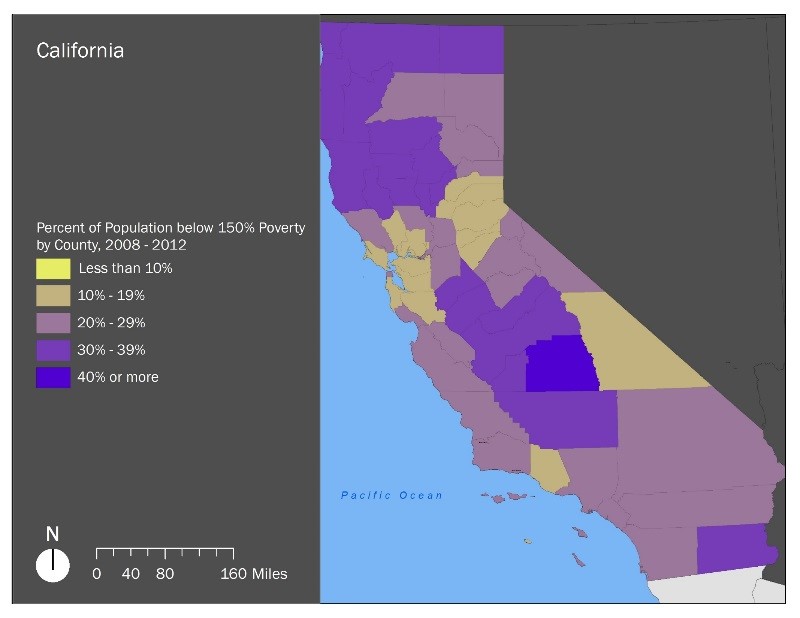
People of color are particularly left behind. Nearly one-third of Californian families (27 percent) are living below 150 percent of the federal poverty level, but people of color bear more of that burden: that same rate is 35 percent for Black families and 40 percent for Latino families. The distribution of poverty can be seen in the map, with the Central Valley, Imperial County, and counties in the far northern end of the state experiencing the most poverty. One cause of poverty is low-paying work. Among full-time workers, near half of people of color (42 percent) earn less than $15 per hour—contrasting sharply with 19 percent of whites. Women of color are also more likely to feel pinched: 44 percent for women of color earn less than $15 an hour—that rate is 23 percent for white women.5
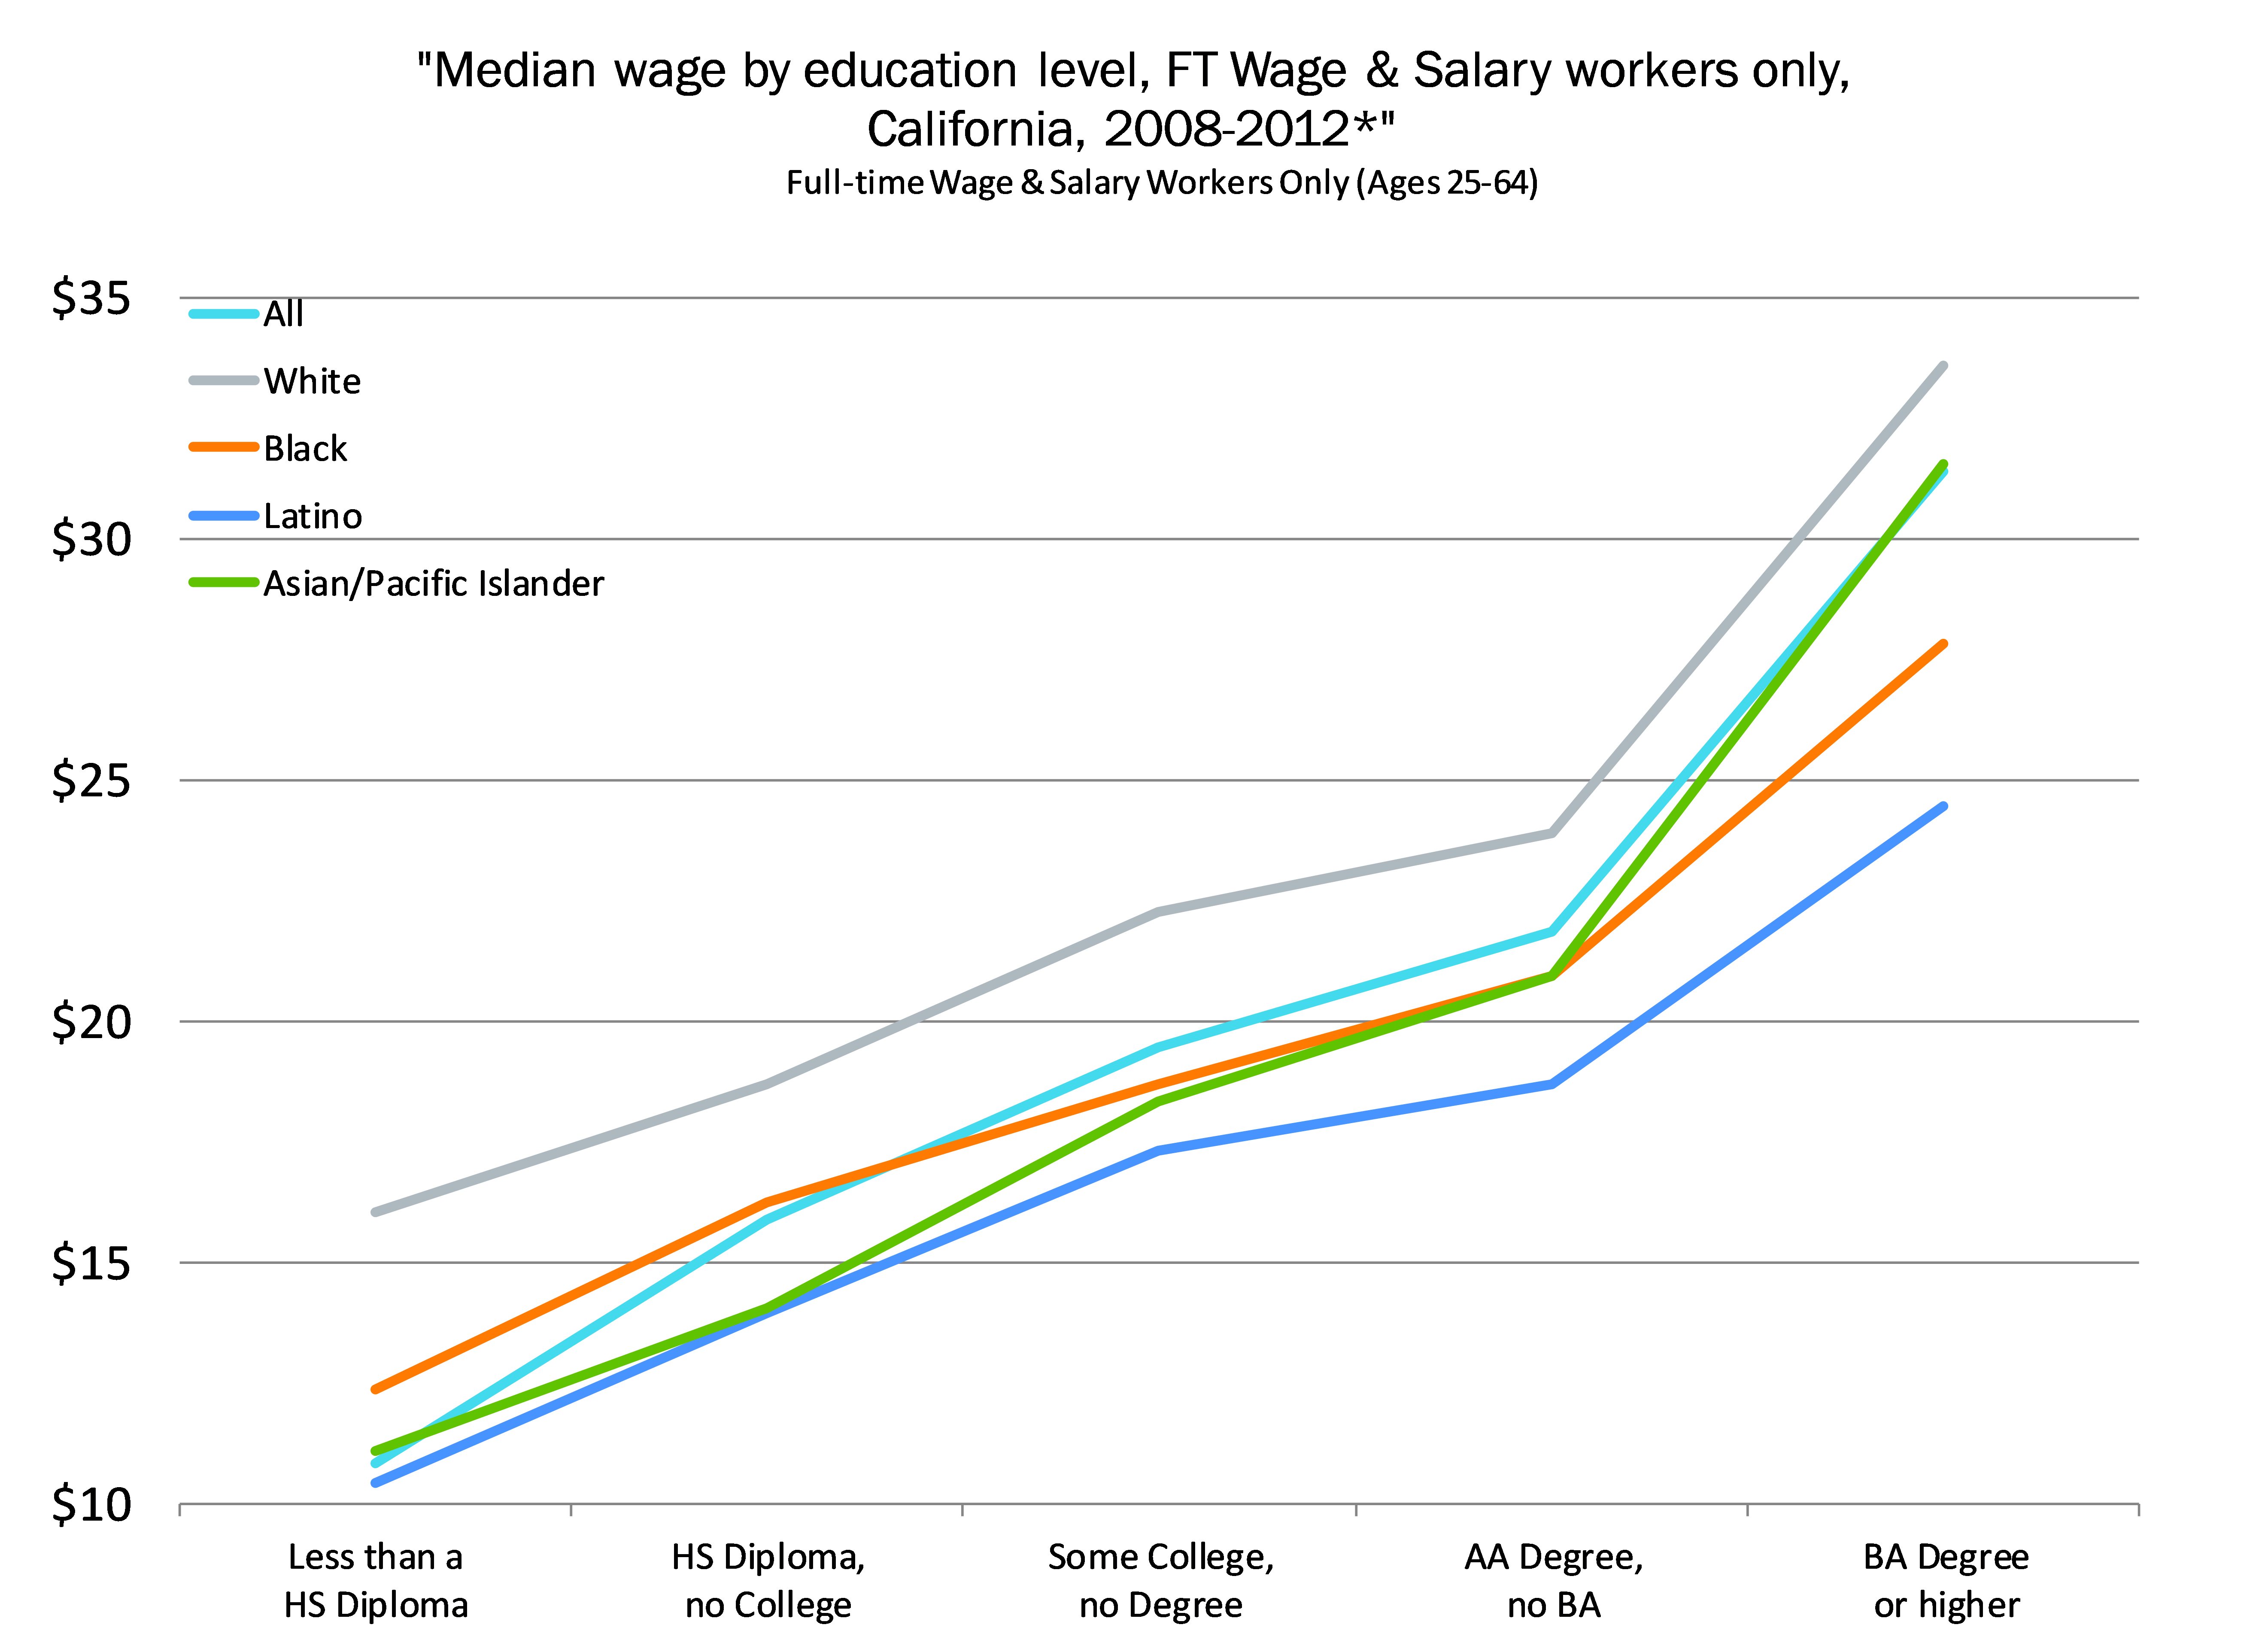
The ever bifurcating economy makes it tough to move out of lower-paying jobs. One mark of this dividing economy: Of the ten fastest growing occupations in California, four require less than a high school education and four require a bachelor’s degree.6 So, education is more important than ever in crossing the chasm. The figure below shows how earnings increase with education. It also shows that education alone cannot completely close the earnings gap between racial/ethnic groups: On average, white Californians earn a higher wage, even as wages begin to converge when approaching the upper limits of educational attainment.
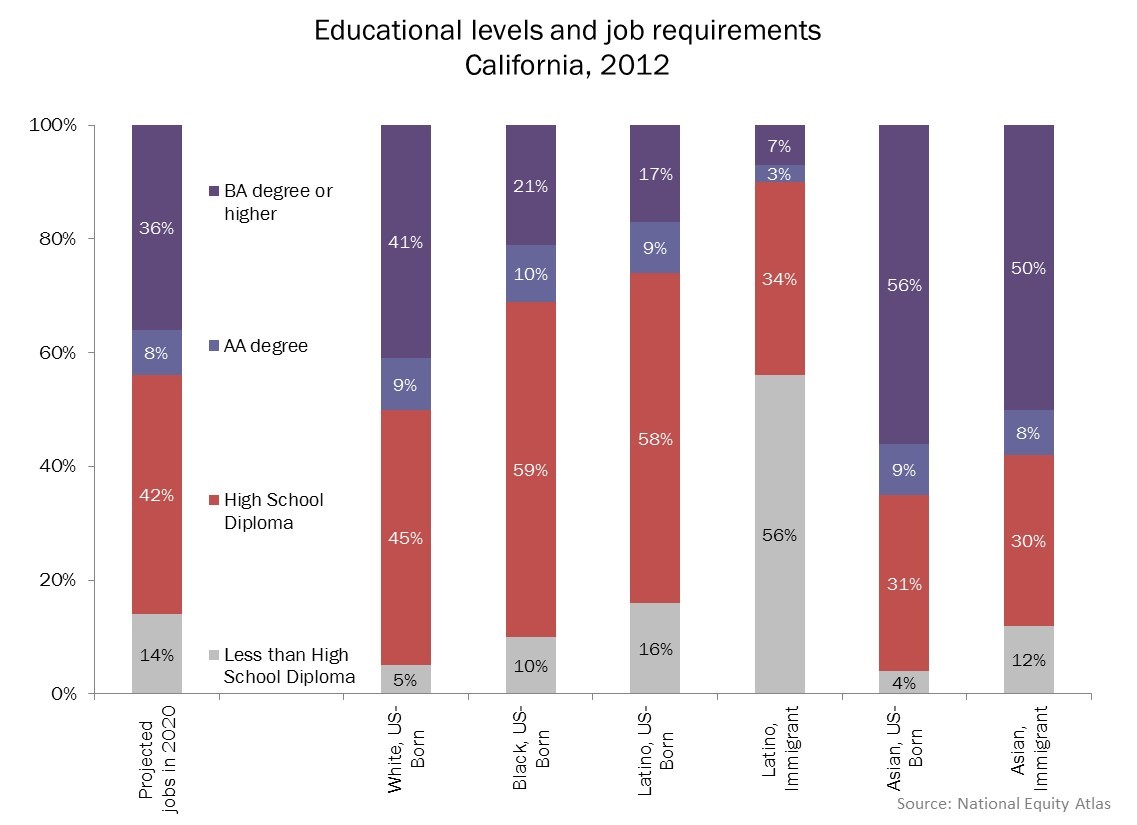
This situation is compounded by the racialized distribution of degrees, as shown by the graph below. The first bar shows the educational attainment that our economy is projected to require in 2020 and the following bars show the composition of educational attainment across racial, ethnic, and nativity groups. As it stands, white and AAPI Californians stand to compete for higher-skilled jobs while African Americans and Latinos stand to be crowded into lower-skilled—and so, lower-paying—jobs.
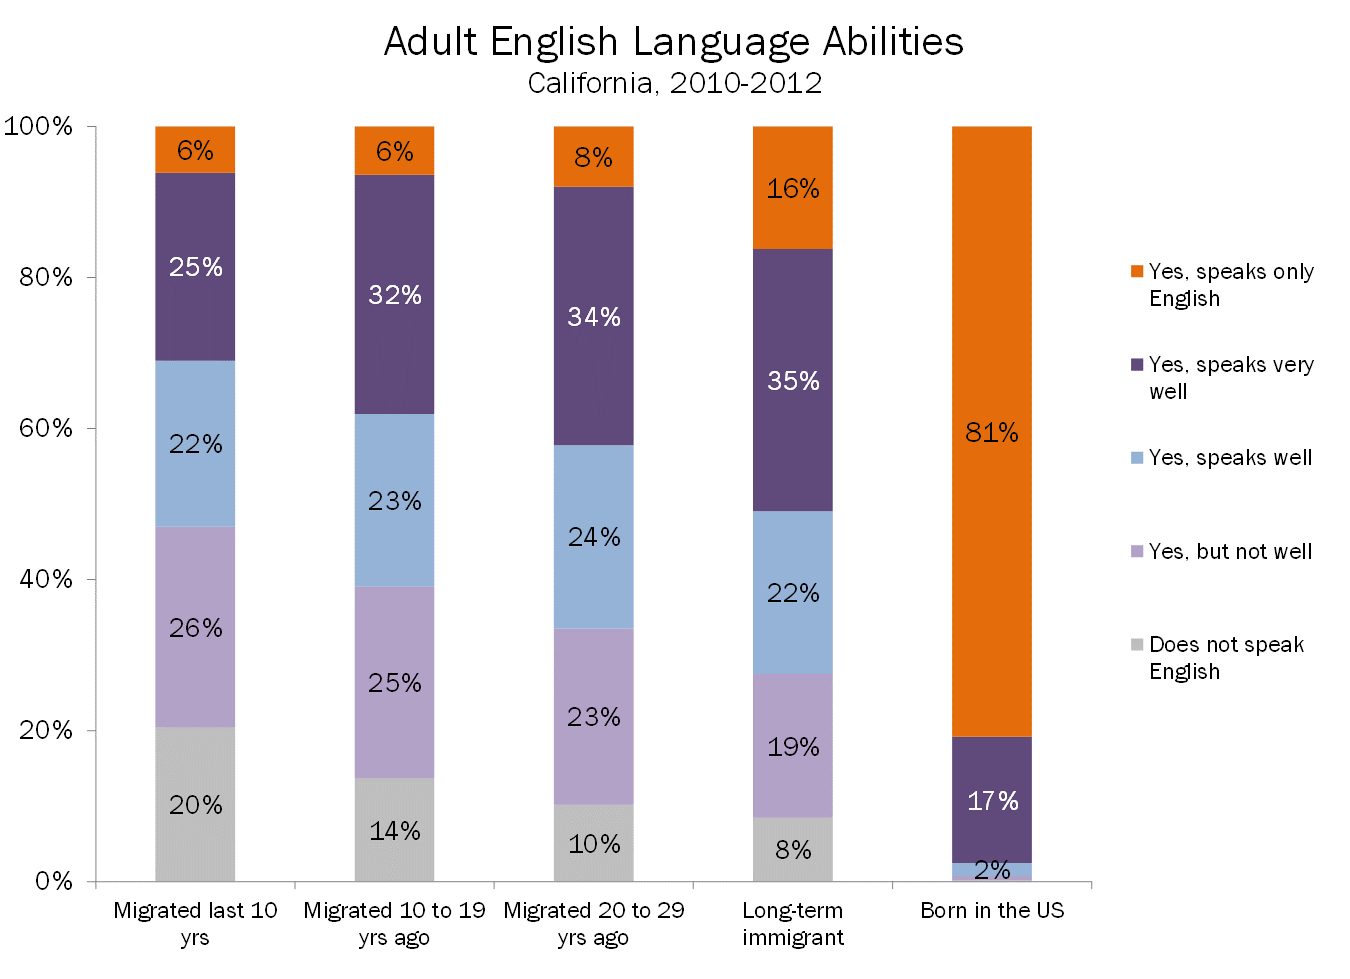
For immigrants, English proficiency is critical to making it in the job market. The great news, here, is that immigrants are picking up English-language skills as they stay in country, as shown in the graph below.2 Yet many Californians speak a non-English language at home: 29 percent speak Spanish at home and 10 percent speak an AAPI language at home. Statewide, 10 percent of households are linguistically isolated; they are households where no one age 14 and over speaks English only or “very well.” Of Spanish-speaking households, this is the case for 22 percent and for those speaking Asian and Pacific Island languages, that rate is 28 percent.7
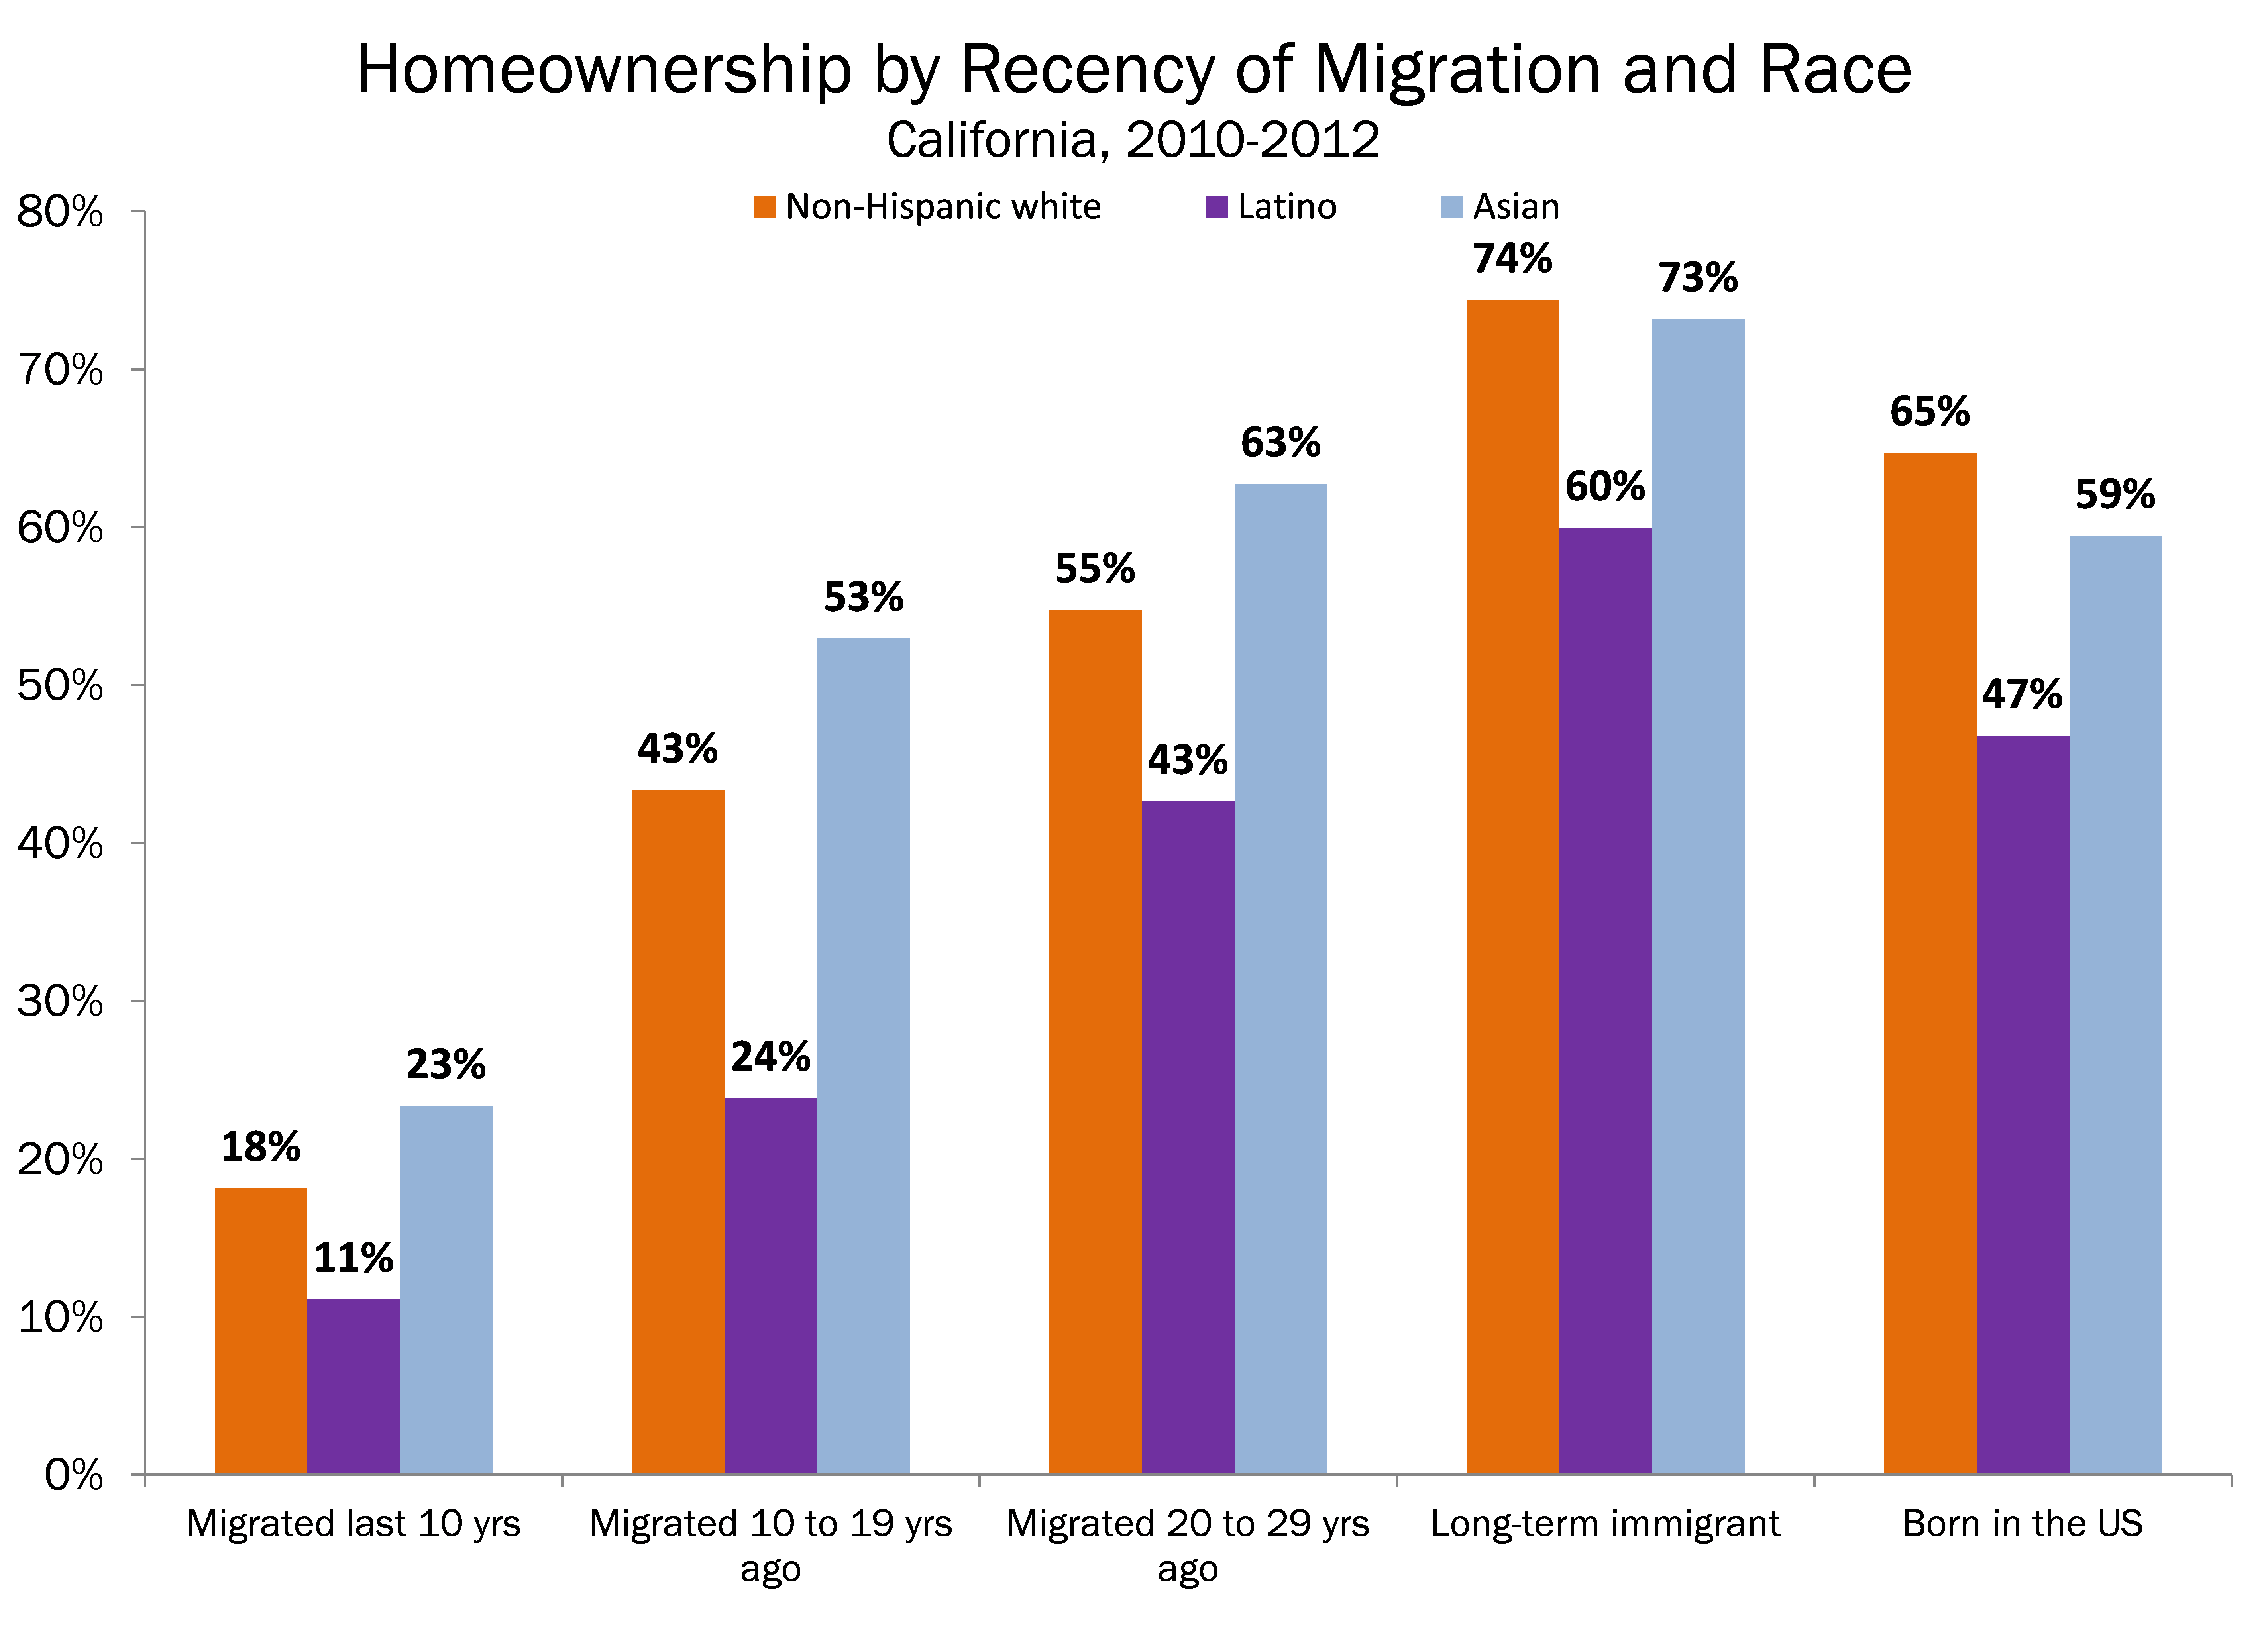
Immigrants are also making progress on homeownership—despite the state’s housing crisis. The graph below illustrates that with time, immigrants buy homes. Nonetheless, in 2012, California was the state with the highest homeowner burden in the nation, with 41 percent of home owning households spending more than 30 percent of household income on housing costs; for renters we are the number two state in the nation, with 56 percent of renting households experiencing burden. A smaller share of white and Asian households experience burden than Black and Latino households. In California, between 2000 and 2012, inflation-adjusted median household income dropped more than 8 percent while rent increased more than 20 percent.8 Another indicator of worsening inequality.
The state of California’s housing stock is not so golden, either. In 2015, the California Housing Partnership Corporation estimated “a shortfall of 956,461 homes affordable and available to California’s lower-income households.”9 At the same time, there is less funding for affordable housing: it decreased by 79 percent between FY 2007/2008 and FY2012/2013. Some places in the state felt a real loss towards equity goals when redevelopment agencies were eliminated as part of the 2011 Budget Act. Though not equally supportive of equity goals, there were over 400 of these agencies that were responsible for roughly $5 billion, collectively.10 At the same time, displacement of lower-income renters is only getting worse in Los Angeles and the San Francisco Bay Area because of gentrification. Any new economic program must consider a solution for our racialized housing crisis.
Immigrants, Incarceration, and Exclusion
As immigrant Californians are held back, so too is the state; nearly one-third of the state is comprised of immigrants of diverse backgrounds.11 California has been passing immigrant-friendly policies that help integrate immigrants—and allow them to contribute fully to the economy—including expanding access to driver’s licenses and professional licensures for undocumented immigrants. Indeed, undocumented Californians make up nearly 9 percent of the state’s workforce (let alone our state’s many authorized immigrants!). Authorization with a path to citizenship would result in a $4.6 billion boost in income, annually, for undocumented workers and would expand the state’s economy.12 Similarly, naturalizing those who are eligible would result in the cumulative increase in immigrant earnings of $17.7 billion.
Our current political economy is holding immigrants back and limiting our state economy.
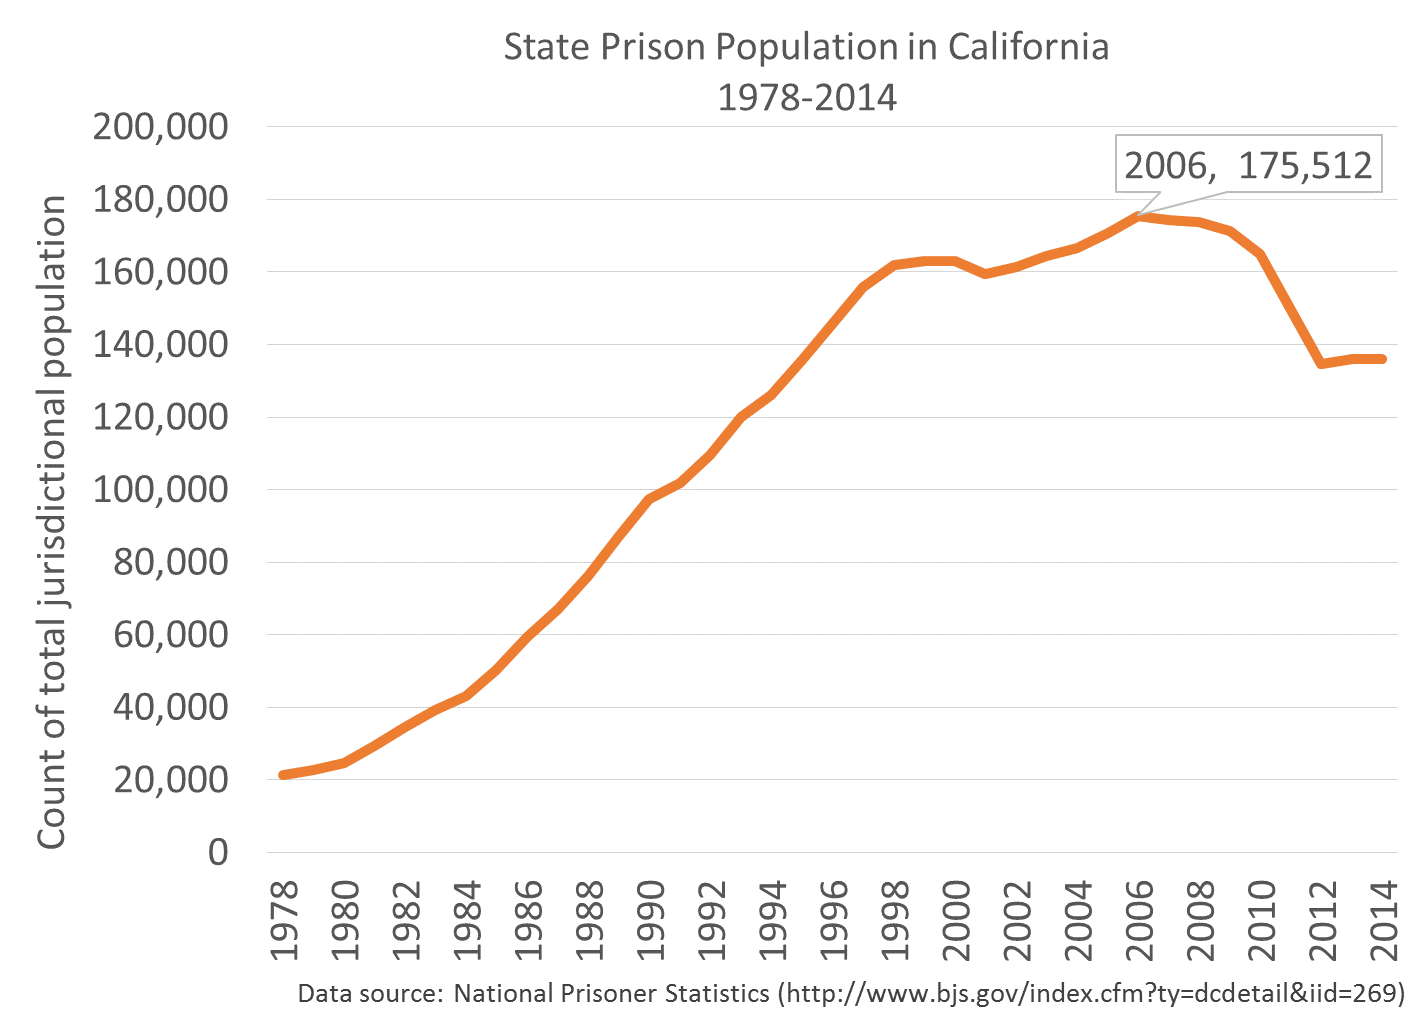
One place where California is investing, however, is the penal system. Notorious for “tough on crime” policies—beginning as early as the 1970s13 —the prison population has drastically increased, hitting its peak at around 175,500 inmates in 2006, as seen in the graph.14 Of course, this is racialized, too: In the state, African Americans are incarcerated at a rate of 4.4 per 100 adult men; for Latinos, that number is 0.9; for non-Hispanic whites, 0.5; and for Asians, 0.03.15
By some measures, corrections spending outpaces investments in higher education, making up a larger share of the state budget than both the University of California and California State University systems.
Realignment, intended to reduce the prison population, has actually increased the system’s cost: $10.07 billion was spent from the general fund in 2015–2016, more than the $9.65 billion spent in the last full budget year prior to realignment. And perhaps most shocking: “It is nearly the same as the $10.12 billion spent in 2007–08, when the state had 40,000 more inmates and more than 80,000 more parolees under their supervision than today.”16
A New Economic Program for California
While California is making important strides towards linking equity and growth, data show that we have a distance to go. We need a fleshed out economic program that will close the many racial, ethnic, and nativity gaps. One that will grow the economy, for those who need it most, first. One that holds up to good economics and can be communicated easily. One that is tangible for everyday Californians and is forward-looking. While it is important to keeping our state golden, it is also important to the nation as other places are going through the type of change we bumbled through in the past two decades.
We can be a model, but it will take broad-based collaboration to make happen. This is our California, this is our future.
Appendix: Maps of the Distribution of Racial/Ethnic Groups across California
Manuel Pastor is Professor of Sociology and American Studies & Ethnicity at the University of Southern California. He also directs the Program for Environmental and Regional Equity (PERE) at USC.
Jennifer Ito is the Research Director at the USC Program for Environmental and Regional Equity (PERE) where she conducts research primarily on issues of regional inclusion and social movement building.
Vanessa Carter is a Senior Data Analyst and Writing Specialist at the USC Program for Environmental and Regional Equity (PERE).
This essay was created by the Blueprint for Belonging project, to find more videos, essays, podcasts, and our California survey on othering and belonging from this series click here.
- 1National Historical Geographic Information System, U.S. Census Bureau, American Community Survey (Steven Ruggles, Katie Genadek, Ronald Goeken, Josiah Grover, and Matthew Sobek. Integrated Public Use Microdata Series: Version 6.0 [Machine-readable database]. Minneapolis: University of Minnesota, 2015).
- 2 a b PERE tabulations of 2010-2012 ACS data (Steven Ruggles, Katie Genadek, Ronald Goeken, Josiah Grover, and Matthew Sobek. Integrated Public Use Microdata Series: Version 6.0 [Machine-readable database]. Minneapolis: University of Minnesota, 2015.)
- 3Alissa Anderson. June 2015. On Average, the Top 1 Percent Earns in Just Over One Week What Middle-Income Residents Earn in One Year. Sacramento, CA: California Budget & Policy Center. Available at http://calbudgetcenter.org/resources/on-average-the-top-1-percent-earns…
- 4Drawing on Economic Policy Institute Analysis of US Bureau of Economic Analysis, US Bureau of Labor Statistics, and US Census Bureau data. Luke Reidenbach. June 2015. California’s Sinking Center: How the Economic Recovery is Leaving California’s Midwage Earners Behind. Sacramento, CA: California Budget & Policy Center. Available at http://calbudgetcenter.org/wp-content/uploads/Californias-Sinking-Cente…
- 5National Equity Atlas.
- 6California Fastest Growing Occupations 2012-2022, Labor Market Information Division, Employment Development Department, State of California, Published: September 19, 2014. Available at: http://www.labormarketinfo.edd.ca.gov/data/occupations-in-demand.html
- 72010-2014 American Community Survey, American FactFinder, U.S. Census Bureau.
- 8California Housing Partnership Corporation. February 2014. How California’s Housing Market is Failing to Meet the Needs of Low-Income Families. Available at http://chpc.net/wp-content/uploads/2015/11/9-CHPCHousingNeedReport02081…
- 9California Housing Partnership Corporation. February 2014. How California’s Housing Market is Failing to Meet the Needs of Low-Income Families, p2. Available at http://chpc.net/wp-content/uploads/2015/11/9-CHPCHousingNeedReport02081…
- 10Maura Dolan, Jessica Garrison and Anthony York. 2011. California high court puts redevelopment agencies out of business. Los Angeles, CA: Los Angeles Times. Available at http://articles.latimes.com/2011/dec/29/local/la-me-redevelopment-20111…
- 11PERE tabulations of 2008-2012 ACS data (Steven Ruggles, Katie Genadek, Ronald Goeken, Josiah Grover, and Matthew Sobek. Integrated Public Use Microdata Series: Version 6.0 [Machine-readable database]. Minneapolis: University of Minnesota, 2015.)
- 12Manuel Pastor and Enrico Marcelli. May 2013. What’s at Stake for the State: Undocumented Californians, Immigration Reform, and Our Future Together. Los Angeles, CA: USC Center for the Study of Immigrant Integration. Available at http://dornsife.usc.edu/assets/sites/731/docs/undocumented_CA.pdf
- 13Morgan MacDonald. 2013. Reducing California’s Overcrowded Prison Population. Themis: Research Journal of Justice Studies and Forensic Science 1(1), Article 2. Available at http://scholarworks.sjsu.edu/cgi/viewcontent.cgi?article=1001&context=t…
- 14Recreated from California Prison Population, 1978 to 2012. Prison Policy Initiative. Available at http://www.prisonpolicy.org/graphs/incsize/CA.html
- 15Ryken Grattet and Joseph Hayes. April 2015. California’s Changing Prison Population. San Francisco, CA: Public Policy Institute of California. Available at http://www.ppic.org/main/publication_show.asp?i=702
- 16Magnus Lofstrom and Brandon Martin. September 2015. Public Safety Realignment: Impacts So Far. San Francisco, CA: Public Policy Institute of California. Available at http://www.ppic.org/main/publication_quick.asp?i=1164