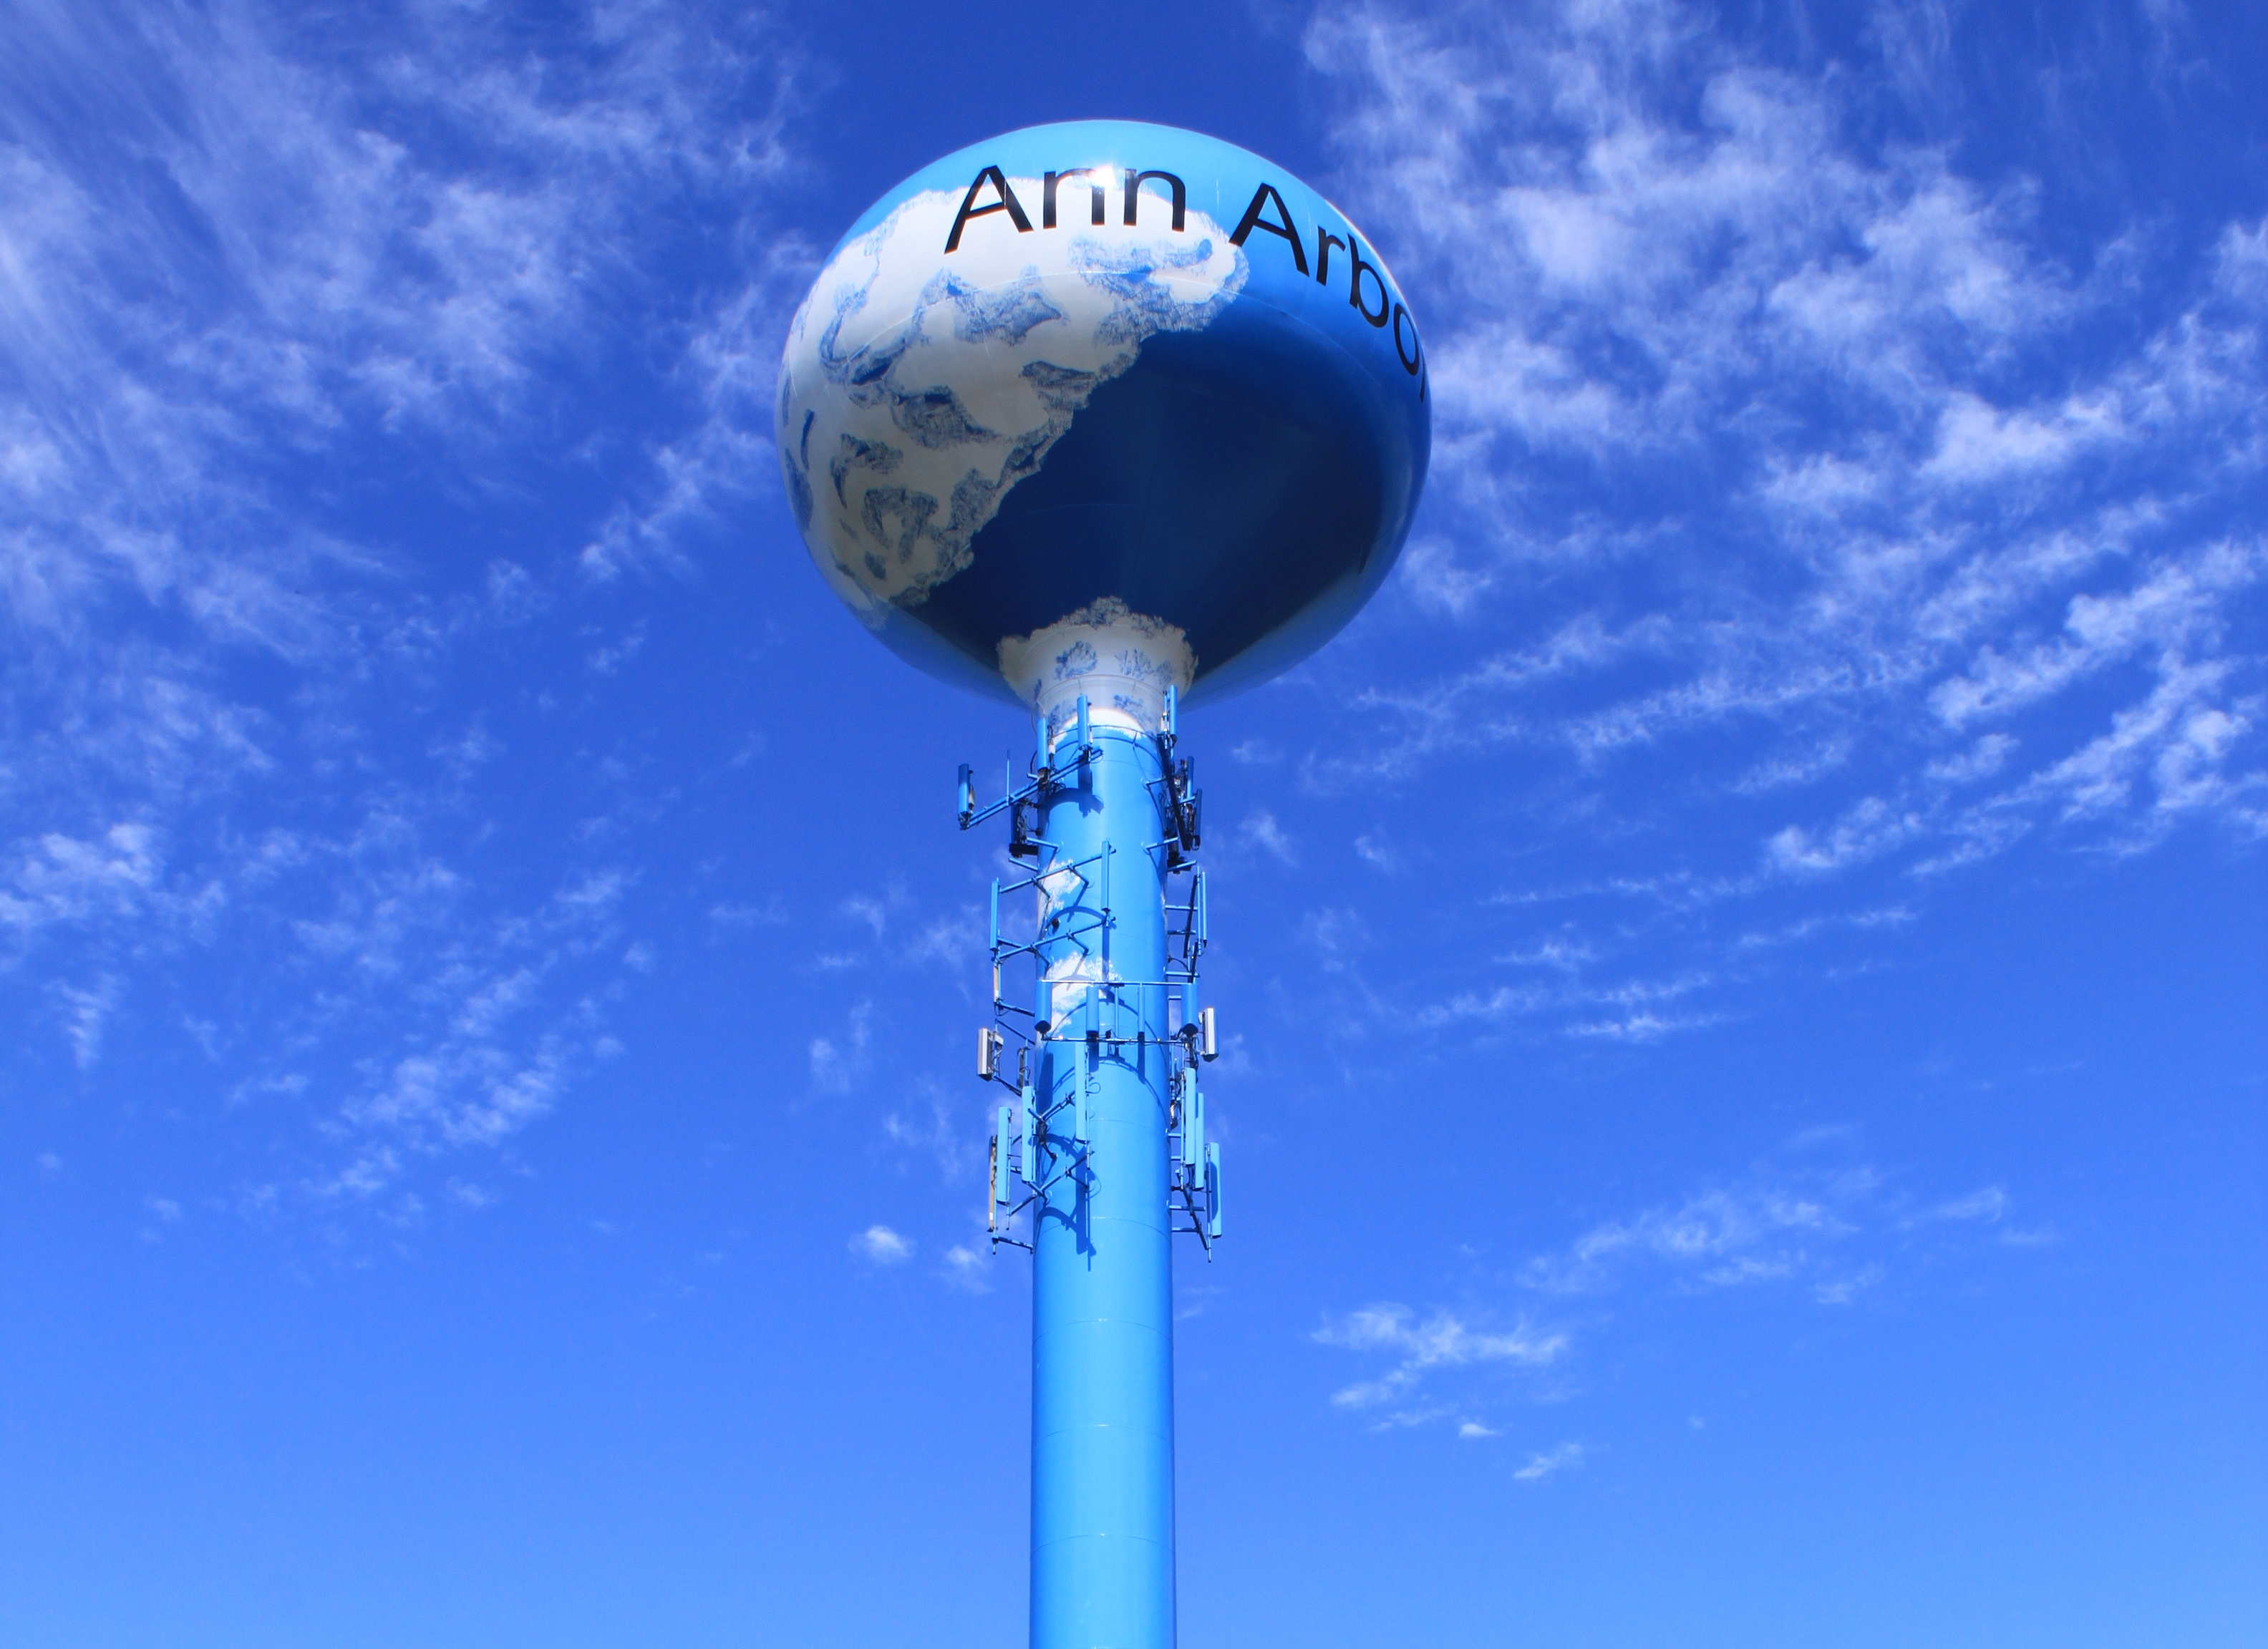
Ann Arbor Water Tower. Photo by Dwight Burdette
Executive Summary
The Context of Water Affordability
In the last few years, increased attention has been paid to rising costs for water and wastewater services, including the need to upgrade and replace water and wastewater infrastructure across the country. In a survey of 260 water utilities and 180 wastewater utilities across 42 states, average water rates increased by 40 percent and average wastewater rates increased by 24 percent between 2008 and 2016 alone. Regional price escalation was highest in the Midwest and Northeast, although these regions had the lowest average water rates overall, while West-Pacific states had the highest prices overall, but a modest price escalation rate.Regarding the results of the study’s regional price and price escalation levels, the report notes: “Some regional trends are observed; however, it is important to note that regional sampling is variable and limited. For example, the Northeast region is represented by only two utilities. Based on the utilities observed, it would appear that the Midwest and Northeast have some of the lowest average water rates (see Figure 8) 5; however, Figure 7 would suggest that these same regions have had some of the highest annual price escalation rates in recent years. Conversely, although the West-Pacific states have the highest average regional water rates (see Figure 8), the annual price escalation rate, at 5.3% (see Figure 7), is only slightly higher than the entire sample average of 4.1%. There are a wide range and variability in both water volume rates and historical price escalation rates across the southern utilities observed in this study, with an average escalation of about 3.5% across the entire southern region. The study’s scope did not include an investigation into why such a large variation exists, but these variations are often driven by local infrastructure investments by the given utility (Walton 2017).” They cite the following report that provides information on the influence of price by local infrastructure investments. Brett Walton, “Price of Water 2017: Four Percent Increase in 30 Large US Cities,” Circle of Blue, May 18, 2017, https://www.circleofblue.org/2017/water-management/pricing/price-water-2....1
Affordability considerations are especially concerning in the context of declining public investment. While public spending on water and wastewater has increased steadily over the last 50 years, the annual rate of increase has decreased for capital infrastructure, as well as operations and management.2 In addition, of the total public spending on water and wastewater systems capital programs—comprised of federal, state, and local governments—state and local governments account for almost 100 percent.3
Figure 1: Federal, State, and Local Government Spending on Water and Wastewater Utilities 1956-2014
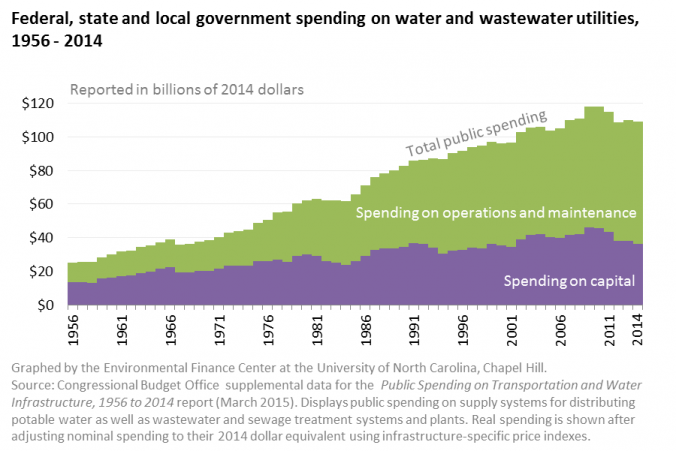
Image source: http://efc.web.unc.edu/2015/09/09/four-trends-government-spending-water/
Figure 2: Source of Expenditures on Local Water and Sewer'

Image source: https://www.usmayors.org/2018/01/10/local-government-investment-in-water...
Figure 3: State and Local Government Spending Decline Since 1980’s
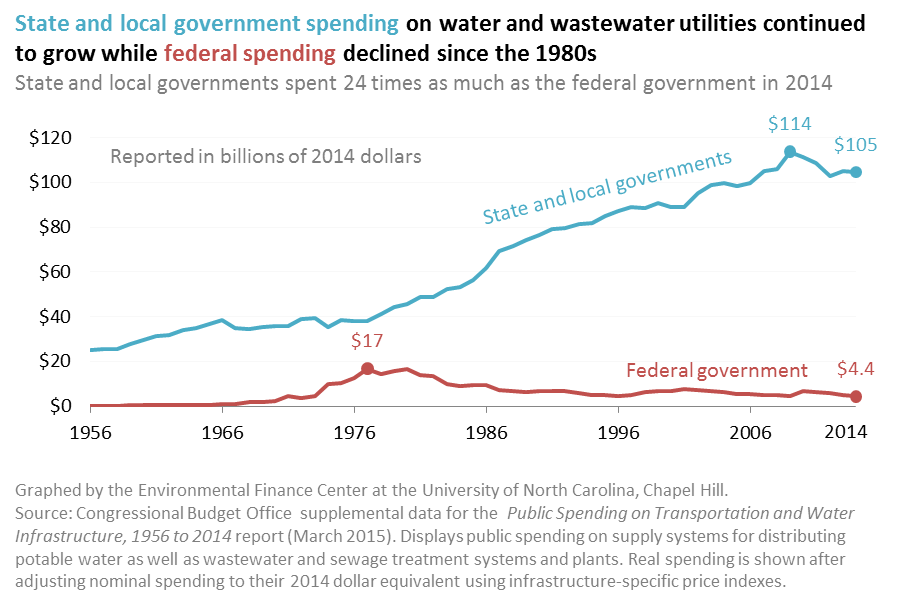
Image source: http://efc.web.unc.edu/2015/09/09/four-trends-government-spending-water/...
Figure 4: "Average Annual Water Price Escalation Rates by Region (2008-2016)"
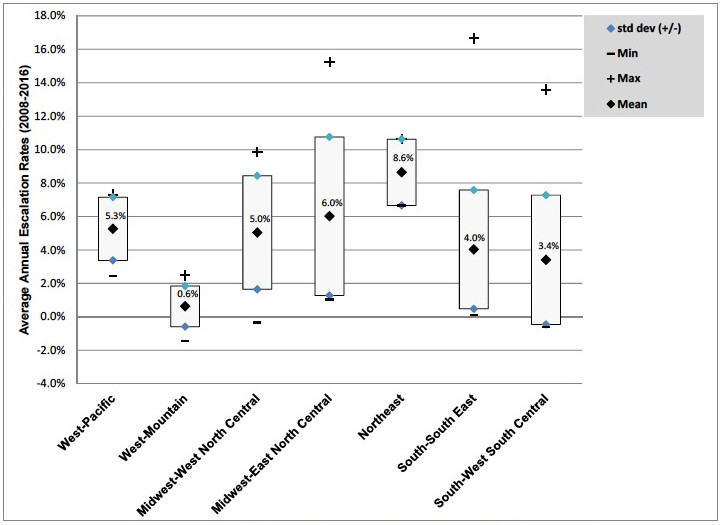
Image source: https://www.energy.gov/sites/prod/files/2017/10/f38/water_wastewater_esc...
Figure 5: "Average Annual Wastewater Price Escalation Rates by Region (2008-2016)"
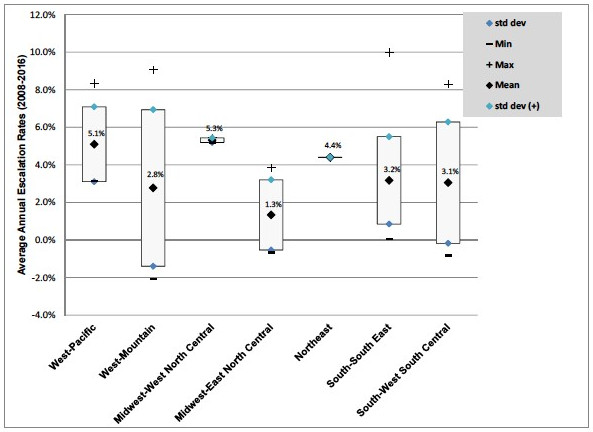
Image source: https://www.energy.gov/sites/prod/files/2017/10/f38/water_wastewater_escalation_rate_study.pdf
These national trends can be seen in Detroit, where the city and the Detroit Water and Sewer District (DWSD) experienced dramatic population decline and disintegration of the local economic base, both before and after the 2008 financial crisis. DWSD-R (DWSD Retail) and the Great Lakes Water Authority (GLWA) continue to need upgrades so they may fulfill environmental quality and public health standards. The system faces significant financial demands to upgrade, maintain, and operate the regional water and wastewater infrastructure. As is the case with most public water and wastewater utilities, local government provides the vast majority of revenue for these purposes. While the larger Detroit metropolitan area serviced by DWSD has experienced modest population growth between 1950 and 2010, the region’s urban core—the city of Detroit—lost 61 percent of its population in that same period. A declining population of users within the city’s center, coupled with DWSD’s institutional structure that places different cost burdens on wholesale suburban customers, makes it extremely difficult to spread overall costs among system-wide users.
Through the bankruptcy proceedings, the Great Lakes Water Authority was created as a state chartered public corporation. Upon the effective date of the lease and services agreements DWSD-R is the way DWSD is described. Former wholesale customers of the DWSD system are now wholesale customers of GLWA, and DWSD-R is also a wholesale customer of GLWA. While DWSD-R retains ownership of the entire system, it is operated and managed by GLWA. DWSD-R maintains specific portions of the system within the city’s boundaries.4
The human right to water depends on the financial capacity to provide access to water. In practice, the demands put upon local government due to the lack of federal investment of infrastructure means that in order for public systems to have the revenue to maintain, operate, and upgrade the system, there must be clear guidance on how to determine who is able to pay and who is not able to pay. This determination is exceptionally important in the growing number of cases in which financially stressed public utilities attempt to maximize revenue through collections enforcement. If a user of the utility is unable to pay, this strategy is ineffective, wasteful of utility time and resources, and a violation of human rights.5
Ultimately, the crux of this multifaceted problem is the need to define affordability in such a way that utilities are able to effectively plan and fund necessary capital improvements, as well as ongoing operations and maintenance, without placing an undue burden on vulnerable populations, especially those who are unable to pay.
Current measures of affordability from the US Environmental Protection Agency (EPA) are widely used but inherently flawed, and have been critiqued by experts, practitioners, academics, government organizations, and even the EPA's own science advisory board.6 Current EPA metrics for water and wastewater use aggregate measures of median household income (MHI), rather than utilizing a place-based analysis. This masks unaffordability in sub-populations within a utility, such as different communities, customer classes, neighborhoods, and demographic groups. Additionally, the use of median shifts the focus away from the low-income segment of the population which is in fact facing affordability issues and is most subjected to behavioral changes in water consumption that impacts utility financial planning.
The findings identified by applying a particular measure of affordability are important for several reasons. If unaffordability is found, permittees are able to negotiate with the EPA to delay or reduce clean water regulations (subject to minimum health standards), avoiding significant legal costs from EPA lawsuits or immediate debt required to finance technological improvements to achieve regulatory compliance.7 Additionally, findings of unaffordability allow beneficial financial terms from EPA-financed state revolving funds that finance infrastructure projects, allowing loans to be converted to grants or even zero-to-negative interest rates.8 Lastly, findings of unaffordability are used as inputs in policymaking wholly separate from the EPA, such as state or local funding decisions around social programs, utility customer assistance programs, and academic, industry, or government studies on socioeconomic characteristics of the populations served.9
This study takes recommendations from experts and government review bodies to develop an alternative metric that uses place-based measures of income. The study first applies the current EPA measures of affordability and then compares the results to two alternative metrics. The first alternative metric is a conservative estimation, introducing place-based data. The second alternative metric is a more realistic estimate that includes place-based data and a focus on households more sensitive to unaffordability pressures. The comparisons demonstrate the extent to which current EPA metrics misrepresent unaffordability, and provide empirical evidence of the true extent of unaffordability. The distributional impacts of current rate designs are also analyzed. The findings are then used to inform discussion of policy alternatives to address utility revenue requirements (including current customer assistance programs), cost allocation, and capital improvements.
Findings
In this study, the EPA and alternative metrics are applied to the DWSD-R service area. The question of water and sewer affordability is one of national significance, and this report adds to the literature by demonstrating the importance of the specific measures used, applicable in both Michigan and other areas across the country.
The first type of metrics studied—the current EPA metrics—find no affordability issues within communities or neighborhoods in the GLWA or DWSD-R service areas, either in the total bill or the separate water/wastewater components.
The second type of metric—what we describe as the conservative specification of an alternative metric—uses local MHI, rather than aggregate measures of MHI. This conservative alternative metric uses census tract MHI to calculate the affordability threshold, introducing data to enable a place-based analysis.
Figure 6: Unaffordable areas for drinking and wastewater costs when using census tract MHI as an affordability threshold
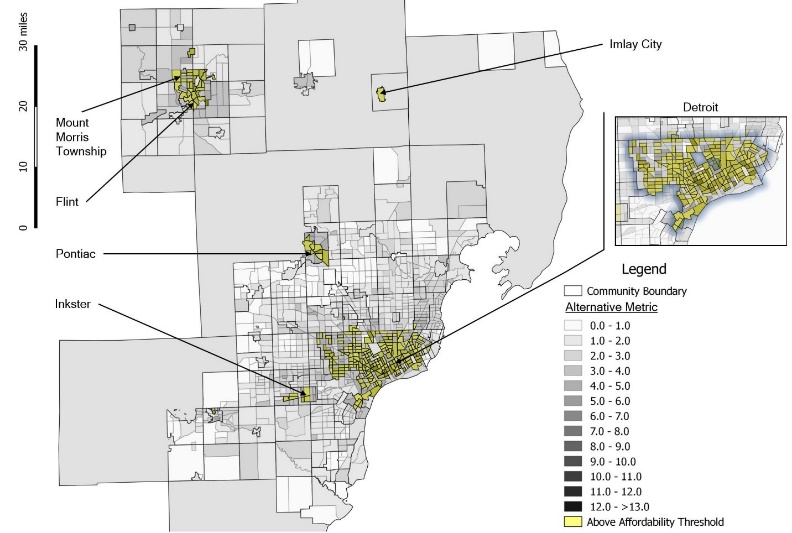
In the image above, this metric finds unaffordability (in yellow) in seven communities, spatially clustered around urban centers, all of which have local MHI below $31,300. Customers within tracts above the metric’s affordability threshold and with incomes under $29,999 comprise 72,185 households in Detroit and 35,864 households within the rest of GLWA.
The third type of metric—what we describe as the realistic specification of an alternative metric—uses local income data like the conservative alternative metric. What sets this metric apart is that it changes the focus of the analysis to the twentieth income percentile (the value below which 20 percent of households exist) rather than the median. The twentieth percentile is commonly used as the lower bound of the middle class. Use of this income level for a water and sewer utility affordability metric has been advocated for by scholars, experts, and a prominent government review panel.
Figure 7: Unaffordable areas for drinking and wastewater costs when using twentieth income percentile as an affordability threshold
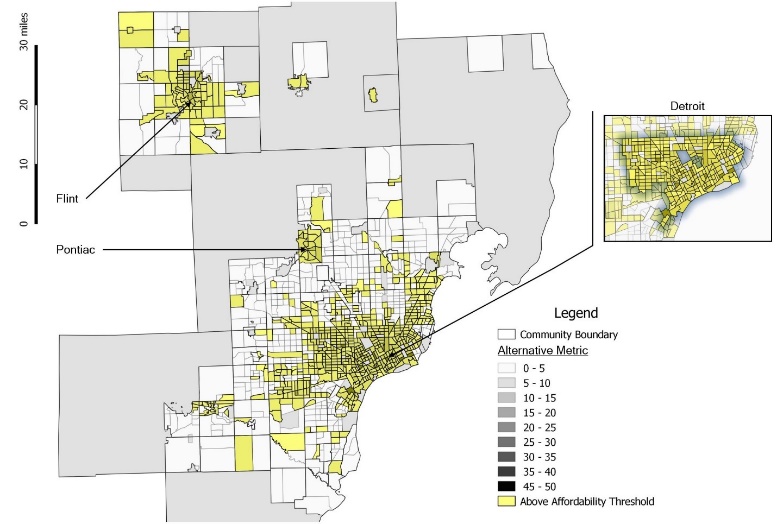
Applying this metric to the GLWA and DWSD-R service areas in the image above shows unaffordability (in yellow) in 45 communities, all of which have twentieth percentile income below $31,000 (aside from a single outlier facing above-average annual water costs). Unaffordability is again spatially clustered around urban areas, but with this metric, we also see it is more widespread into suburban areas. This spatial clustering pattern is consistent with other studies that have shown “pockets of poverty” using different metrics, which are patches of unaffordability within communities—individual census tracts that rise above the metric threshold within a community that does not itself as a whole break the threshold. Customers within tracts above the metric’s affordability threshold and with incomes under $29,999 under this specification comprise 104,181 households in Detroit and 204,308 households within the rest of GLWA.
In sum, 308,489 households in the GLWA and DWSD-R service areas with incomes below $29,999 are facing water and sewer insecurity. This is meaningful for efforts to create equity and more evenly distribute resources within regional areas through targeted policy measures. Literature has shown that census tracts with median incomes below $32,000 have higher percentages of disabled people, higher unemployment rates, higher levels of public assistance income, higher incidence of sole female heads of household, larger percentages of minority residents, and lower rates of health insurance.
Further, analysis of the data from the GLWA and DWSD-R service areas looking at distributional impacts match these trends, with very clear correlations between the percentage of the population that is African American and census tracts facing the most intense unaffordability issues when using the conservative specification. Using both the realistic and the conservative alternative metrics, the percentage of the population receiving public assistance and percentage of the population with a disability also follow the general patterns of census tracts that rise above the metric threshold, meaning that these vulnerable populations are the customer segments most likely to face affordability issues.
Policy Alternatives
Targeted policy alternatives for addressing unaffordability in Michigan should consider what has been described as a restrictive legal environment. A Michigan Constitutional Amendment and a State Supreme Court case interpreting it (referred to as Headlee/Bolt) found that some utility charges that the utility categorized as user fees were illegal taxes.10 However, there is disagreement among experts and practitioners about how this decision could apply in the context of water affordability policies and institutional practices throughout the state.11 More restrictive interpretations of the Headlee/Bolt case are not settled law as demonstrated by a number of cases brought against townships in circuit court, which have had mixed results.12
Throughout the US, policy alternatives that attempt to address unaffordability fall under two general categories:
- Customer assistance programs: typically short-term policies like temporary assistance, water efficiency upgrades, or flexible billing terms
- Alternative rate designs: long-term policies that structure rates according to certain criteria, like income, usage, or minimum amount of water needed for human health
Both categories of programs are sometimes described as water affordability programs, which can create ambiguity between different parties since both categories offer financial relief in different ways. Notably, the second category can promise a more sustainable resolution to affordability problems.
The design of the customer assistance program offered by GLWA and DWSD falls into the first category. Called the Water Residential Assistance Program (WRAP), it provides bill credits, arrearage (past due bills) assistance, water efficiency audits, and minor plumbing repairs to households with income at or below 150 percent of the federal poverty level and that meet a number of other criteria. The program helps households facing temporary unaffordability crises, but certain features like a two-year cap on participation, minimum payment qualifications, focus on arrearages over bill credits, and limited funding means that it does not offer sustainable relief or address structural causes of unaffordability. In Detroit, the area with the most acute needs and largest WRAP funding, the program is estimated to have reached only 11 percent of qualifying households. Estimated WRAP funding needed to reach the rest of the need in Detroit alone ranges from $32 million to $46 million. It is clear that, even with an infusion of additional funds, WRAP or similar customer assistance programs alone are not sufficient to durably and sufficiently solve the region’s affordability problems.
Customer assistance programs treat the symptoms of unaffordability, but alternative rate designs treat the structural root causes. This study provides the necessary empirical evidence to tailor an alternative rate design and provides a set of recommendations to implement it. The study holds significance for institutions that regulate and operate the 52,000 water plants and 16,000 wastewater treatment plants that serve 86 percent of US residents. Relieving the burdens of affordability problems is urgent, and developing a shared understanding of the degree of the problem will enable better communication about strategies and solutions to address it.
Introduction
Residential water bills have risen consistently since 2010—and annual increases have varied between 8 or 9 percent to 3.1 percent.13 Between 2010 and 2015, there was an overall 41 percent rise in both water and sewer utility service costs.14 Local efforts by stakeholders and policymakers to address affordability have expressed a need for empirical evidence on the extent of unaffordability, what groups those impacts fall on, and how trends have changed over time.15
Water is essential to human well-being. Water is the foundation of health and is used for cooking, bathing, cleaning, and waste disposal. Lack of access to water prevents individuals from full participation in the economy, limiting both their own and their communities’ productivity.16 Special rapporteurs from the United Nations have recently turned attention to the access to clean water and adequate sewer systems as part of the institution’s work on human rights statutes on poverty, water, and sanitation.17 The Detroit Water and Sewer District’s (DWSD) 2014 water shutoffs garnered so much national and international attention that it compelled two UN special rapporteurs to visit the city to speak with stakeholders and impacted communities about the issue.18 The special rapporteurs found that:
Without water, people cannot live a life with dignity… It exacerbates inequalities, stigmatizes people and renders the most vulnerable even more helpless. Lack of access to water and hygiene is also a real threat to public health… In line with the mandates entrusted to us by the Human Rights Council, we would like to underline that the United States is bound by international human rights law and principles, including the right to life as well as the right to non-discrimination with respect to housing, water and sanitation and the highest attainable standard of health. These obligations apply to all levels of Government – federal, state and municipal… When people are genuinely unable to pay the bill, it is the State’s obligation to provide urgent measures, including financial assistance, especially low tariff or subsidies, to ensure access to essential water and sanitation for all. Not doing so amounts to a human rights violation.
At the same time, the special rapporteur explicitly states, “Water and sanitation does [sic] not have to be free.”19 They recognize that addressing affordability is a balancing act between ensuring the human right to water and long-term utility viability.
Between 2014 and 2016, DWSD shut off water to 83,752 homes due to nonpayment,20 and in March 2018 threatened to shut off water to 17,461 more homes after a moratorium on shutoffs ended in early May.21 Utility operators have commented on how they struggle to determine who is able to pay and who is not.22 The spread of residential water shutoffs as a collection strategy erroneously assumes that households can afford to pay. The majority of water shutoffs, particularly residential water shutoffs, are due to arrears accumulated by households’ inability to pay, not a lack of willingness to pay or a desire to "freeload."23
Water and sewer utilities in the US are considered natural monopolies and rate setting is typically dominated by studies that measure the willingness of users to pay (WTP) for water. However, as wealth, wage, and income inequality accelerate across the US, rates for water and sewer utilities set according to WTP is entirely mismatched to the empirical reality that shows some people are simply unable to pay.24 These studies have also shown that lower-income households are most sensitive to increasing water rates—meaning that if there are any changes in the rates, these are the households most likely to use less.25 In the context of extreme austerity and lack of federal funding, the dominant cost recovery rate-setting model neglects the profound role of water and sewer utilities in public health and other cascading effects inaccessibility can create.26
Experts have pointed out that there is a “business case” to be made that addressing affordability offers utilities financial benefits, not just costs.27 In the fiscal year 2016, Detroit budgeted $1.6 million for costs related to customers' inability to pay, such as account collections activities, service disconnections, and payment plan administration. An additional $7.8 million contract has been signed with a water shutoff contractor for future shutoff expenses between 2018 and 2021.28 Such activities could be effective if payments were simply late, but when households are “genuinely unable to pay the bill” as the UN special rapporteurs point out, those collections activities by the utility are essentially wasted resources and effort, going after money that customers simply do not have. Additionally, analysis by Detroit’s water utility found that decreasing the proportion of income that a water/wastewater bill comprises from 8 percent to 4 percent improves collectability by 25 percent and reduces the probability of shutoff by 10 percentage points.29
For many households, and for the local governments that finance system costs, there are already large problems. Local governments and residents of the GLWA service area are among the people and places facing this problem. However, it is not just Detroit facing unaffordability issues: the infamous Flint lead crisis began when the city decided to change the source of its water in an attempt to lower costs,30 and some smaller cities and townships have faced citizen pushback and even lawsuits over rate issues.31 A recent US Government Accountability Office report analyzing water infrastructure found that Michigan has the largest number of large and midsize cities facing declining populations. Of the 14 large and midsize cities identified, all but four are located in southeastern Michigan. Declining populations further complicate the ability of utilities to spread the costs of the necessary infrastructure investments and are generally more economically distressed than growing populations.32
There are economic as well as humanitarian reasons to provide protections related to affordability. This report will use empirical evidence and novel methods recommended by experts and government review panels to determine the extent of unaffordability, who is impacted, and how utilities can make adjustments to address structural affordability.
Background
This section will detail the information needed to understand how utilities set rates and plan infrastructure investments, as well as how existing measures of affordability are designed and implemented. It will end with expert, practitioner, academic, and government critiques of those existing measures of affordability, leading into the Analysis section that proposes and implements an alternative metric, which will be used to inform policy alternatives to address affordability.
Utility Approaches to Infrastructure Investments and Rate Setting
GLWA needs to make $2.8 billion33 in capital improvements over the next five years without placing an extreme burden on the population it serves. Modern utilities use a cost-based approach—allocating costs to different groups (“classes” or types of customers, geographically diverse communities, etc.) based on the cost of including them in a utility’s service—in determining what rates to charge different types of customers.34 According to one of the foundational textbooks for cost allocation and rate design, determining how to do so is difficult and open to interpretation:
Cost allocation is inexact; no single correct approach or method exists. Much depends on the criteria used by analysts… The choice of a cost allocation approach depends largely on utility management objectives and regulatory policy considerations… As in selecting a cost allocation method, the choice of rate design involves tradeoffs among the goals of efficiency, equity, revenue adequacy, and administrative feasibility.35
The American Water Works M1 manual identifies some of those possible utility management objectives as:36
- Full cost recovery
- Revenue stability and predictability
- Stability and predictability of rates
- Promotion of efficient resource use
- Fairness in apportionment of total costs of service among different ratepayers / avoidance of undue discrimination within rates
- Dynamic efficiency in responding to changing supply and demand patterns
- Simple to understand and administer
The manual further identifies distinct situations and pricing considerations utilities must face, such as:37
- Standby rates
- Drought surcharges/rates
- Low-income affordability rates
- Economic development rates
- Indexed rates
As will be demonstrated in this report, there is a lack of affordability in the GLWA and DWSD-R service areas existing even before needed investment costs are added, and clear differences in ability to pay between customer classes. There is also a business case to better incorporate this structural mismatch in utility rate design and cost recovery, enabling savings on collections activity. As the National Academy of Public Administration summarizes:
Ultimately, the challenge is one of maintaining affordability while also recovering the full costs of providing water services, which, in absence of low-income assistance, is limited by low-income households' ability to pay. Rate structures themselves may place a disproportionate share of the burden on low-income households.38
EPA Measures of Affordability
When discussing affordability, the United States Environmental Protection Agency (EPA) is central to the conversation. This is in part due to the enormous cost burdens on water systems stemming from the federal requirements promulgated in the 1972 Clean Water Act (CWA), 1974 Safe Drinking Water Act (SDWA), and subsequent amendments to those acts. The EPA creates and enforces regulatory standards for this legislation, including compliance with the regulatory status of contaminants in drinking water, source water protection, overflow discharges from treatment plants, and more. In the context of these regulations and associated permitting standards, affordability has a twofold definition: 1) the ability of utilities and local governments to afford capital investments and operation costs required to meet EPA regulations, and 2) the ability of residents within a utility’s jurisdiction to afford the retail cost of water and wastewater service—costs that underpin system revenue.39
Local regulators and utility operators use EPA guidelines in decision-making to promote public health and environmental quality. The regulatory authority of the US EPA and state EPA agencies and their ability to take enforcement action incentivizes systems to work with the EPA to create compliance schedules and take advantage of funding programs offered. Unfortunately, the costs of maintenance and system upgrades needed to meet regulatory standards are often too great for local systems to bear alone. This leaves local governments responsible for covering the large majority of costs and makes user revenue a vital component of the overall revenue needed to cover expenses.
Affordability for households is a primary concern for local governments tasked with setting rates to recover system costs. The EPA’s metrics have become the de facto definition of affordability in the majority of academic and practitioner discourse, including in applications beyond what the EPA originally intended. This has led to widespread critiques of the EPA’s measures, both in theory and practice, which are detailed below.
EPA Affordability Metrics
The EPA’s 1997 “Combined Sewer Overflows—Guidance for Financial Capability Assessment and Schedule Development”40 (1997 guidance) establishes a two-phase approach to assess a permittee’s (utility or municipality) capability to meet federal mandates and provide affordable wastewater service. The first stage is a “residential indicator” (RI), which is a ratio of a utility’s average cost per household for wastewater treatment to median household income (MHI) across the system. For large or complex systems that span multiple communities, MHI is a weighted average of MHI for each community, scaled by the size of that community. The EPA stated that an RI threshold of 2 percent system-wide would be deemed unaffordable.
If the 2 percent RI threshold is crossed, a second stage is triggered that implements a “financial capability indicator” (FCI), which uses six economic indicators (bond rating, overall net debt as a percentage of full market property value, unemployment rate, MHI, property tax revenues as a percent of full market property value, and property tax collection rate) combined in a matrix with the RI to reach a finding of “low,” “medium,” or “high” burden.
Taken together, the RI is meant to indicate the ability of a utility’s residents across the system to afford the allocated costs of wastewater service, and the FCI is meant to assess a utility’s ability to fund or finance capital investments required to meet EPA regulations.
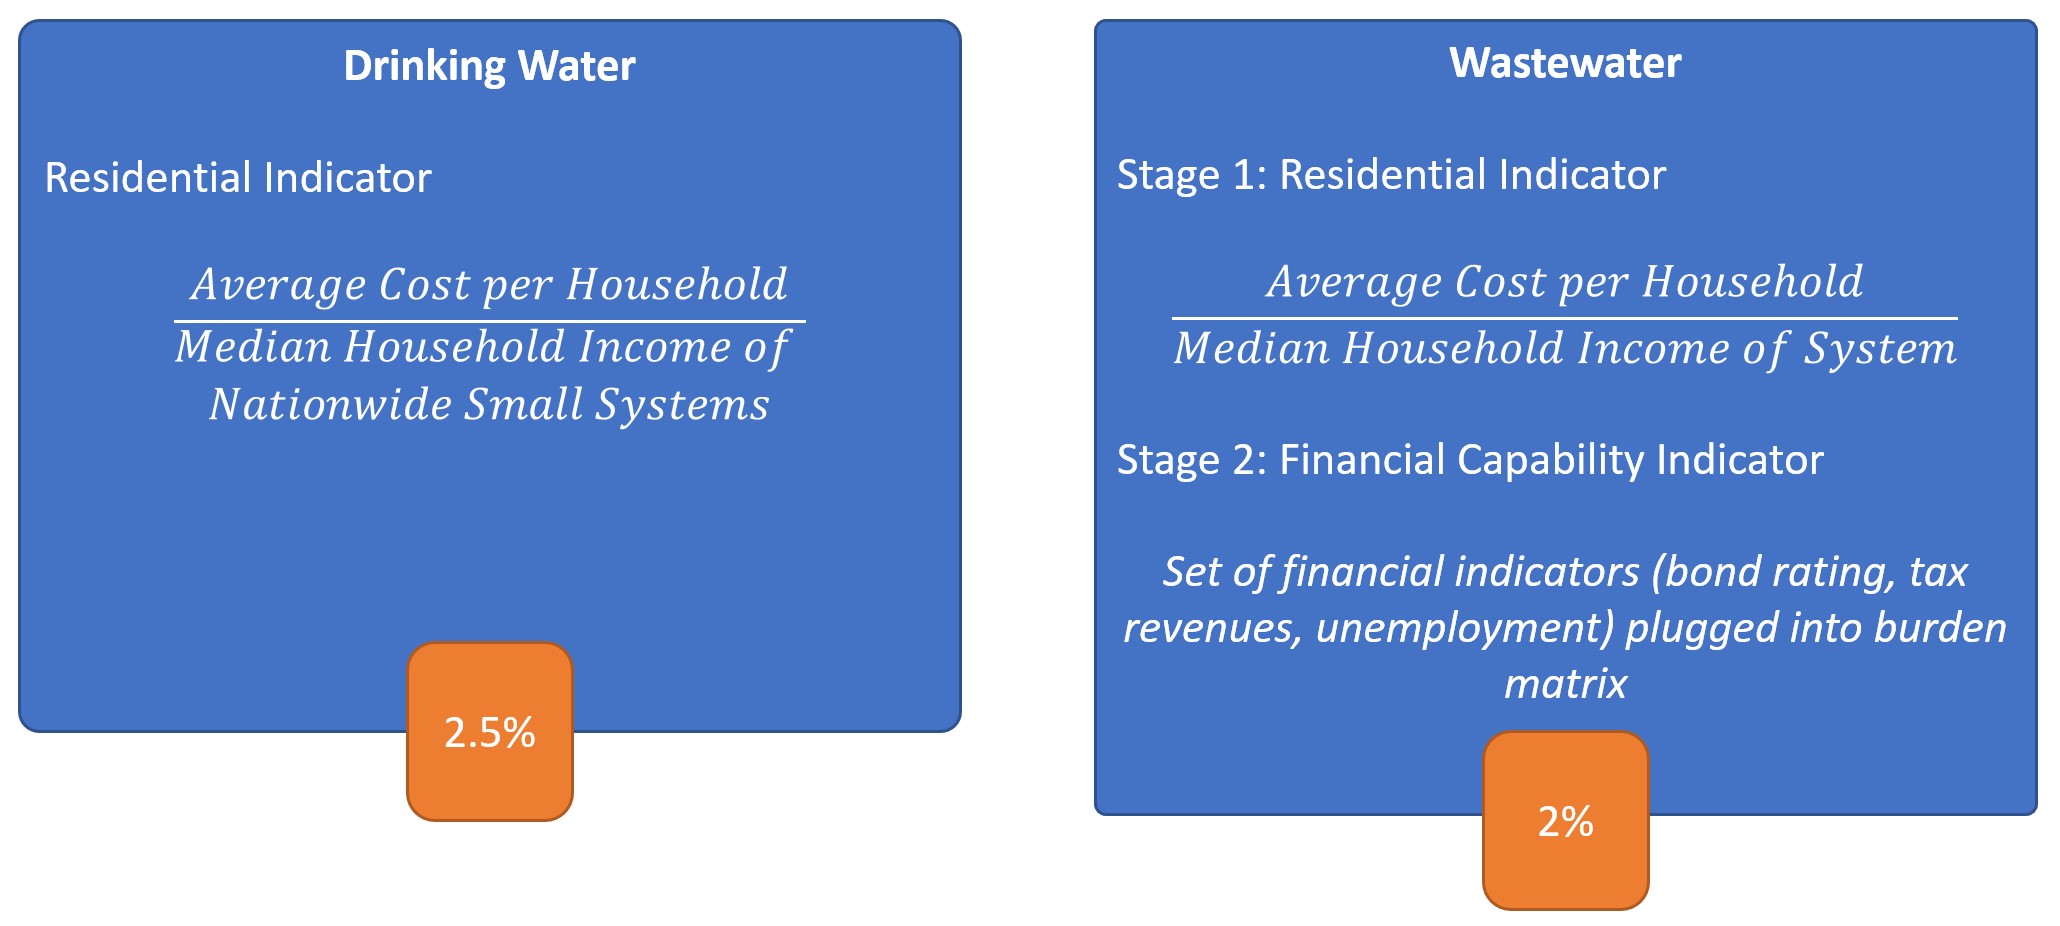
For drinking water (drinking water RI), EPA considers a single stage analysis of the ratio of average cost per household to MHI of small systems.41 The MHI for small systems was determined internally by the EPA from data contained in the Community Water System Survey and US Census.42 In practice, this functions similarly to the wastewater RI, but with a national average MHI rather than local. A threshold of 2.5 percent for drinking water is deemed unaffordable.
Figure 8: EPA Affordability Metrics and Thresholds
In either case, if the EPA’s metrics find problems of unaffordability in wastewater or drinking water for a system, permittees can negotiate with the EPA for a temporary “variance” or “exemption” from CWA or SDWA regulations.43 These variances and exemptions differ based on whether the negotiations are over wastewater or drinking water, as well as on the size of the system. The temporary status of variances and exemptions are intended to allow a utility time and financial space to raise the necessary capital for implementing the technology required to come into compliance. During this time, the utilities must implement minimally required technology improvements, hold public hearings regarding the planned variance/exemption, reevaluate water quality results at set intervals, and set a schedule for full compliance. Variances and exemptions are important tools that save utilities significant amounts of money by avoiding legal costs from EPA lawsuits over noncompliance or costs incurred from having to procure emergency bond deals at unfavorable terms.
Another important impact of findings of affordability relates to additional funding sources for utilities. The EPA offers low-cost infrastructure loans as part of the Drinking Water State Revolving Fund (DWSRF) and Clean Water State Revolving Fund (CWSRF).44 Both are federal-state partnership programs funded by Congress and administered by the EPA, which provide grants to states who then manage individual loan disbursements for capital improvement projects to public utilities. Importantly, the EPA grants states the ability to set project priorities and customize loan terms to meet the needs of “disadvantaged communities” through additional subsidies beyond zero-interest loans, including grants, principal forgiveness, and negative interest rate loans.45 If a utility is not found to have affordability problems, these important financial tools may not be applied.
Lastly, findings of unaffordability by the EPA metrics matter because they can be used as inputs in decision-making wholly separate from EPA regulations, such as state funding decisions for social programs related to utilities, utility decisions on customer assistance programs or alternative rates, and academic, industry, or government studies on the socioeconomic characteristics of customer classes.46
The drinking water and wastewater affordability thresholds are often combined by practitioners, experts, and academics to recognize a total water cost of 4.5 percent as unaffordable.47 The RI, FCI, and drinking water RI will hereafter be referred to as “EPA metrics” collectively or “wastewater metric” and “drinking water metric” individually.
Critiques of EPA Metrics
The EPA metrics have been roundly criticized from a wide variety of sources, including academics,48 industry experts,49 practitioners,50 federal agencies,51 and the EPA’s own science advisory board,52 spanning decades. Until very recently, however, very little action has been taken to address deep flaws in these metrics and their use.
In 2016, the Senate Appropriations Committee directed the EPA to contract with the National Academy of Public Administration (NAPA) to “conduct an independent study to create a definition of, and framework for, community affordability of clean water”53 that encompassed both drinking water and wastewater. NAPA produced a comprehensive literature review, over 100 stakeholder interviews (including with PA Financial Advisory Board, Council of Mayors, water industry groups, academics, consultants, governmental entities, and others), a stakeholder survey, and a roundtable discussion with stakeholders and experts.54 Their 2017 report produced a set of findings and recommendations related to affordability concerns and improvements to EPA metrics, among other things.
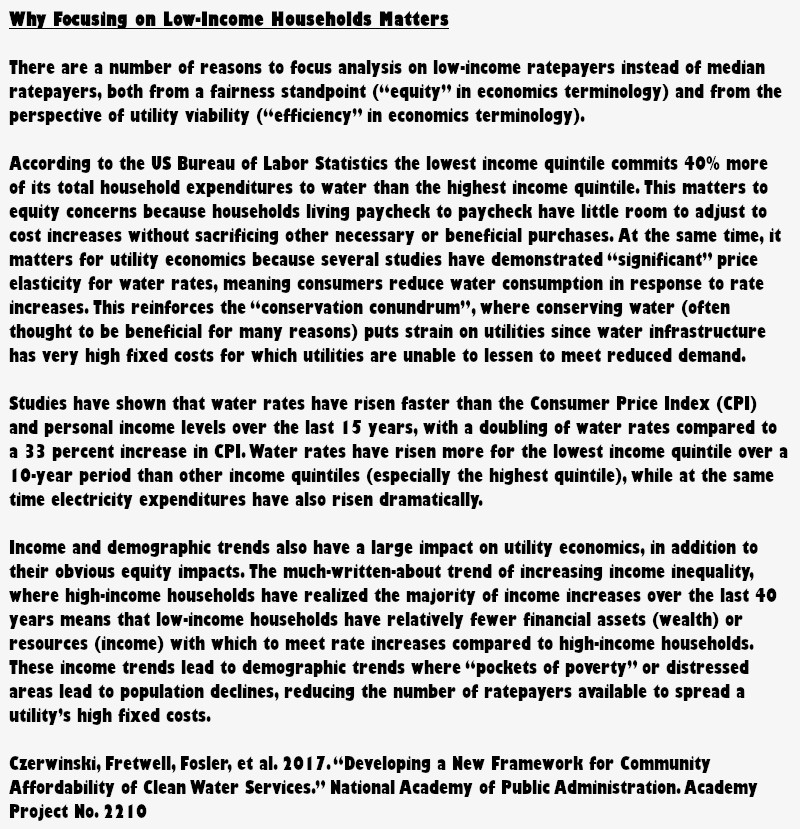
Although both RI and FCI were criticized in literature and by stakeholders as “inaccurate” and “inadequate,” NAPA found that the RI was the “most severely criticized” of the two.55 Stakeholders and the relevant literature agree that:56
- MHI is an inadequate metric for identifying affordability issues for the most vulnerable low-income ratepayers, who are least able to absorb higher water bills and have the most pressing concerns regarding affordability.
- The RI numerator does not include all water costs that users face on utility bills since it only factors in utility operations costs and costs for proposed capital projects, rather than user surcharges or fixed costs included in some rate designs.
- The basis of the 2 percent wastewater RI threshold is “unknown and inherently subjective.” The 1997 guidance did not contain a methodological or theoretical justification for the number. The threshold is not consistent with BLS consumer expenditure data and appears inconsistent with the economic theory that would suggest water and wastewater expenditures must be weighted against other non-discretionary costs (housing, food, healthcare, clothing, energy, transportation) and available discretionary income.
- The static nature of the thresholds ignores critical trends. The fact that neither the 2 percent wastewater nor the 2.5 percent water thresholds have been changed since the 1990’s, while water costs have risen faster than other utility costs, the Consumer Price Index (CPI), and income growth trends, reinforces the impression that the threshold is subjective, is not tied to empirical data, and does not have a framework to adjust to changing real-world dynamics.
Additionally, because the RI component for wastewater is a two-stage process, an inaccurate first-stage RI finding means an FCI assessment will not even take place. Because of that and the above findings, the scope of this report will focus on RI for both water and wastewater.
In discussions with NAPA about the above critiques, the EPA noted that the RI was intended to assess overall system affordability rather than individual household affordability, that it desired a “common starting point” for negotiations between regulators and individual permittees, and that an adjustment to the metrics would increase staff workload by reopening negotiation around existing consent decrees (legal agreements between EPA and permittees regarding actions and timelines required to achieve compliance with CWA and SDWA regulations).57
The EPA also released an updated framework for wastewater affordability in 2014 wherein it acknowledged that financial capability “is on a continuum” and is not best represented by rigid break points or thresholds. It affirmed that the EPA would consider other information presented by permittees not contained in the FCI, such as income distributions by group or geography, poverty rates and trends, population and labor market trends, and extenuating circumstances around bond ratings, among others.58 Critically, however, the updated framework did not change any of the underlying 1997 affordability evaluation processes or thresholds, nor did it comment on the drinking water RI.
EPA’s points may be valid. However, NAPA found stakeholders report that in practice “in certain regions, EPA regional staff, state regulators, and enforcement staff still rely almost exclusively on the 2 percent MHI test… notwithstanding EPA’s view that EPA is providing flexibility to permittees in assessing financial capacity and excessive burden… this is a problem particularly in EPA’s mid-west Region 5 (Illinois, Indiana, Michigan [emphasis added], Minnesota, Ohio, and Wisconsin).”59 NAPA points out that the deficiencies in RI and FCI “limit the ability of those metrics to establish an acceptable and equitable common starting point.” Further, localities report that once they use the 2 percent measure, they often feel locked into it from a regulatory perspective or do not understand that they can engage with the EPA for flexibility on mandates (or they lack the technical capacity to do so).
Industry experts, practitioners, federal agencies, academics, government review panels, and even the EPA’s science advisory board all agree that current affordability metrics are inaccurate and should be updated. Accurate measures of affordability are critical for both equity and efficiency in utility cost allocation and rate design.
Figure 9: Why Focusing on Low-Income Households Matters
Analysis
This section will propose implementing an alternative metric, demonstrating how the EPA’s current metric misrepresents unaffordability and providing empirical evidence of the actual extent of unaffordability, as well as the distributional impacts of the current rate structures in Southeastern Michigan on various groups. This empirical evidence is then used to inform discussion of policy alternatives to address utility revenue requirements, cost allocation, and capital improvements, as well as funding requirements for customer assistance programs or alternative rate designs in the Alternatives section.
Methodology
This analysis identifies and quantifies the gap in the measurement of affordability issues by first applying EPA’s metrics to GLWA, a large and complex system which serves a diverse population, and then applying a two alternative metrics. The ramifications of this gap are then analyzed in the context of local affordability programs and future capital expenses, noting how under-estimation of affordability by current metrics negatively impacts decisions around funding for assistance programs and distorts cost allocation and revenue recovery inputs for utility capital planning and rate design. GLWA wholesale customers (all communities besides Detroit) and DWSD retail (Detroit) customers are analyzed separately to acknowledge the administrative regime stemming from the GLWA/DWSD lease and operation agreements. This analysis shows meaningful outcomes that should inform GLWA and DWSD-R customer practices—most notably the pursuit of an effective, robust affordability plan or alternative rate structure. Policy alternatives and recommendations based on the identified gap and estimated needs for both low-income ratepayers and utility planning are proposed.
Choice of Alternative Metrics
A number of alternative metrics have been proposed by both academics and practitioners. Figure 2 from NAPA’s meta-analysis summarizes a selection of proposals:
Figure 10: Residential Indicator Metric Alternatives
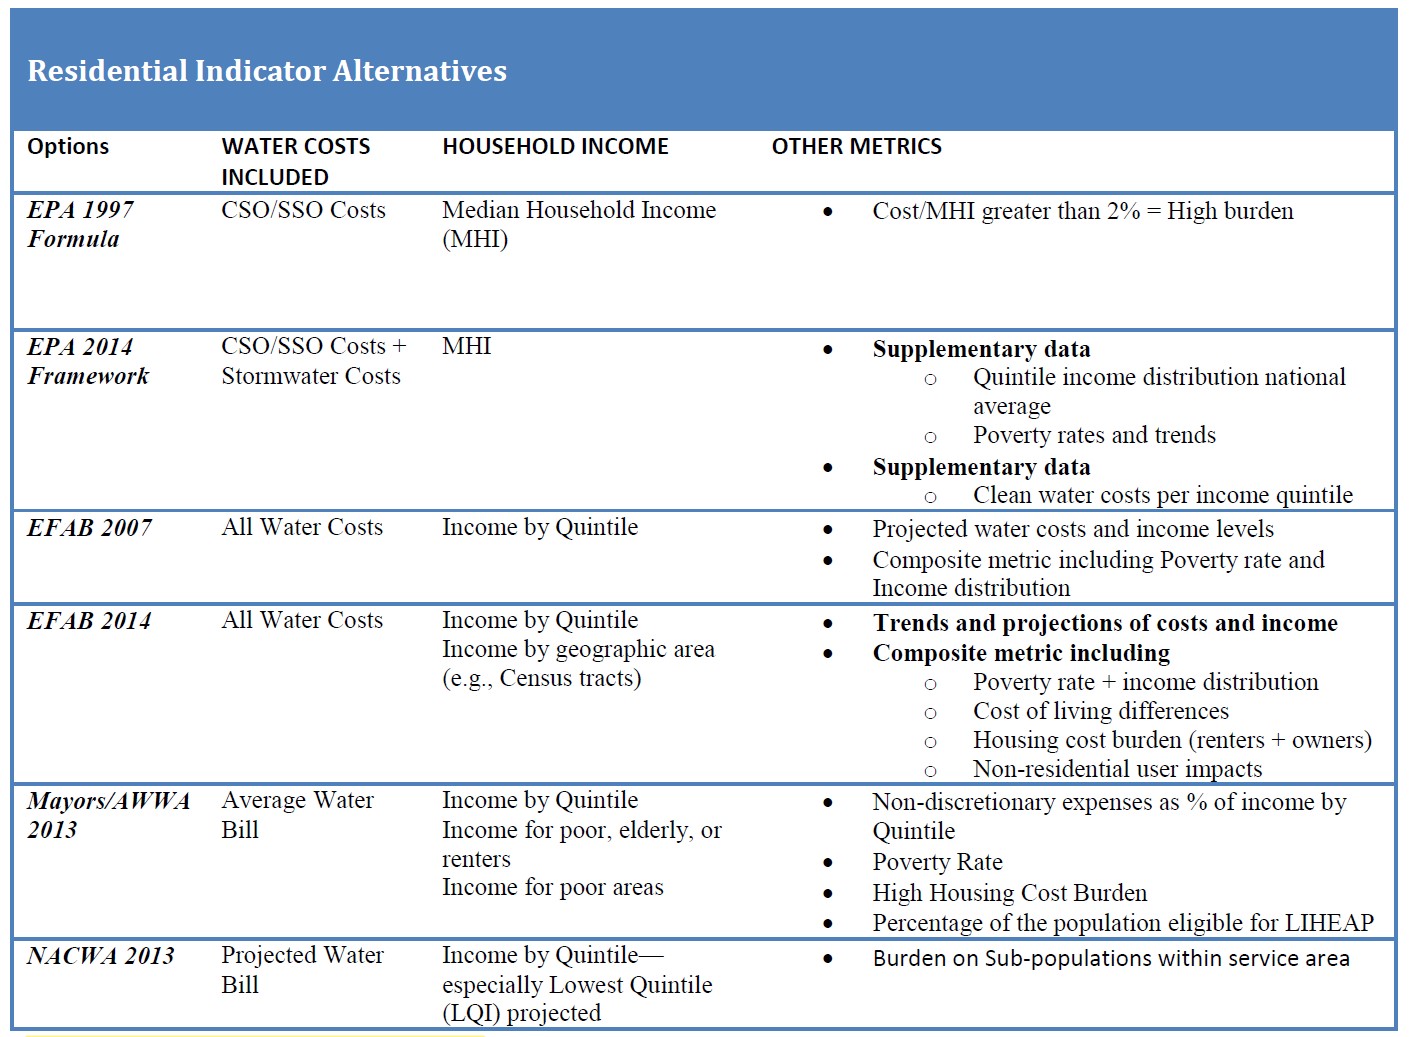
Image source: Czerwinski, et al., 2017.
Most proposals attempt to gain a clearer picture of user affordability by using income quintile instead of MHI. Other proposals not mentioned in the NAPA table suggest using local community MHI rather than EPA’s nationwide small system MHI or utility-wide MHI to identify clusters of unaffordability missed by larger-jurisdiction MHI.60 Multiple proposals use the average ratepayer water bill rather than system costs to more directly compute user affordability before analyzing utility financial capability (acknowledging the interconnection between the two). Finally, most proposals include supplemental contextual information such as trends, poverty rates, housing cost burden, and analysis of sub-populations within a utility service area.
The alternative metrics used here will follow NAPA’s recommendations of simplicity, readily available public data sources, and applicability for comparative analysis among different utilities (see Appendix 2).61 This is consistent with the desire for this study’s metrics to be replicable by multiple stakeholders—from the government to community members. It will also follow recommendations to include drinking water and wastewater costs together, to focus on low-income users rather than median users, and to identify the size of the population of vulnerable users relative to the utility’s total ratepayer base.62
Implementation of Two Alternative Metrics
The alternative metrics in this analysis will be done in two rounds to illustrate the extent that EPA’s current metric misrepresents affordability. Both will focus on place-based analysis, which was consistently emphasized during NAPA’s stakeholder engagements63 , as opposed to EPA’s current use of aggregated MHI—an approach that is not sensitive to local variation.
In this study, we first measure affordability using the EPA’s metrics as interpreted by the Affordability Assessment Tool for Federal Water Mandates published by the American Water Works Association, United States Conference of Mayors, and Water Environment Federation.64 They describe the EPA’s wastewater RI as “average per household cost of wastewater bills relative to median household income in the service area”65 rather than strictly adhering to the EPA’s 1997 guidance that describes costs as a function of annual operations and maintenance expenses, annual debt service, residential share of costs, and number of households.66 Similarly, the Affordability Assessment Tool interprets the EPA’s drinking water RI to include annual household bills as the cost indicator. This technique is also among the metric options recommended by the NAPA report.
Figure 11: The EPA metric and this study’s conservative alternative
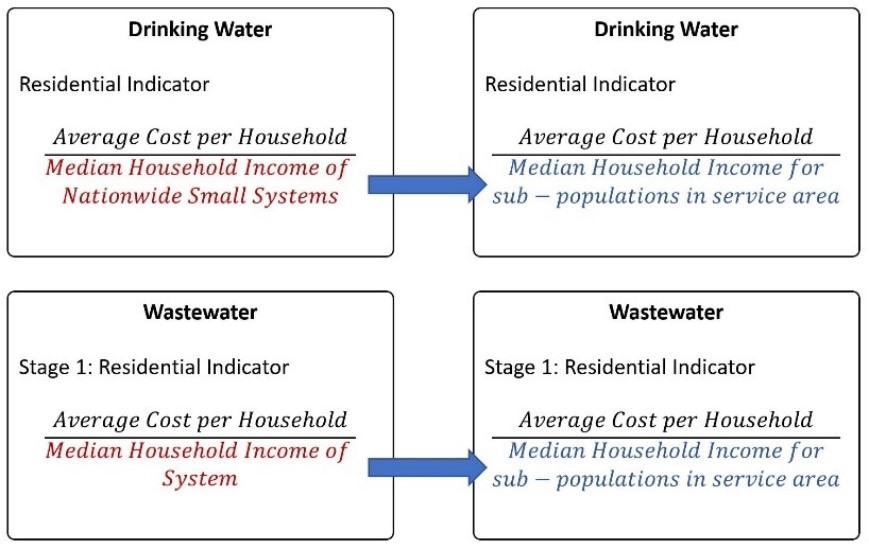
The first alternative metric in this study will change the EPA metric’s numerator from “selected operations costs” and “planned upgrade costs” to actual costs faced by households by substituting total household bills (water, wastewater, and combined) based on average usage volume. This shifts the focus from theoretical cost allocation to actual average costs faced by households. The first alternative metric will also change the denominator from national small-system MHI for water and system-wide MHI for wastewater to local MHI for sub-populations within the service area for both water and wastewater. This shifts the focus from aggregated measures to place-based analysis that more accurately represents utility users and gives a sense of the size of vulnerable users relative to total ratepayer base. This amounts to a conservative estimate of affordability that does not radically challenge the EPA’s chosen threshold values and is not responsive to the much-agreed-to need to focus on lower-income households. This setup biases the specification of the alternative metric in favor of the status quo tendency to mask unaffordability, meaning that if unaffordability is found, then the extent of those issues are severe enough to show through a model prone not to reveal it. Accordingly, findings from applying the second alternative metric are more believable because the results do not disappear if preferred modeling assumptions are removed.67
Figure 12: The EPA metric and this study’s realistic alternative
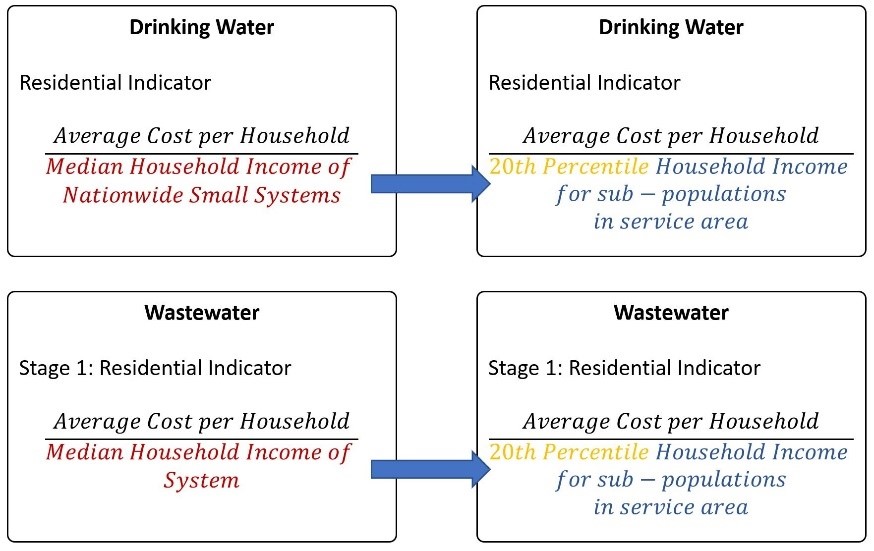
The second alternative metric will again change the numerator in the same way as the first round. The denominator, however, will change from MHI for sub-populations to income of the upper bound sub-populations to income of the upper bound of the first quintile (equivalent to the twentieth percentile) for those sub-populations. This refocuses the income analysis away from the unrepresentative median and instead to what is often considered the lower boundary of the middle class68 to better reflect the set of individuals who are most sensitive to rate increases. This sensitivity is defined as those subjected to greater harm from rate increases but also more likely to adjust consumption behavior, the first being critical for equity analysis and the second being critical for efficiency analysis. (See Feature Box at the end of the Background section)
Data Sources
Demographic and economic data for primary affordability calculations come from the United States Census Bureau’s American Community Survey (ACS) 2016 five-year estimates. Spatial data comes from the United States Census Bureau Topologically Integrated Geographic Encoding and Referencing (TIGER) products. Demographic and economic data for time series and trend analysis come from ACS one-year, three-year, and five-year estimates, with decennial census as needed. Retail water and sewer rate information was obtained from GLWA, DWSD, and individual cities, towns, townships, and charter townships. When rate information was not available online, it was obtained via telephone from local officials. System usage and capital financial data were obtained from GLWA and DWSD.
Great Lakes Water Authority Service Area
The GLWA service area (including the City of Detroit and leased DWSD infrastructure) is large and complex, spanning 1,069 square miles, 2,700 miles of transmission lines, five water treatment plants, and 19 booster pump stations for water delivery, as well as three interceptors, eight combined sewer overflow facilities, and five pump stations for wastewater management.69 The water system includes 127 member partners that purchase water from GLWA representing 119 individual communities.70 The wastewater system serves 87 member partners representing 76 individual communities.71
Figure 13: GLWA Water Service Area
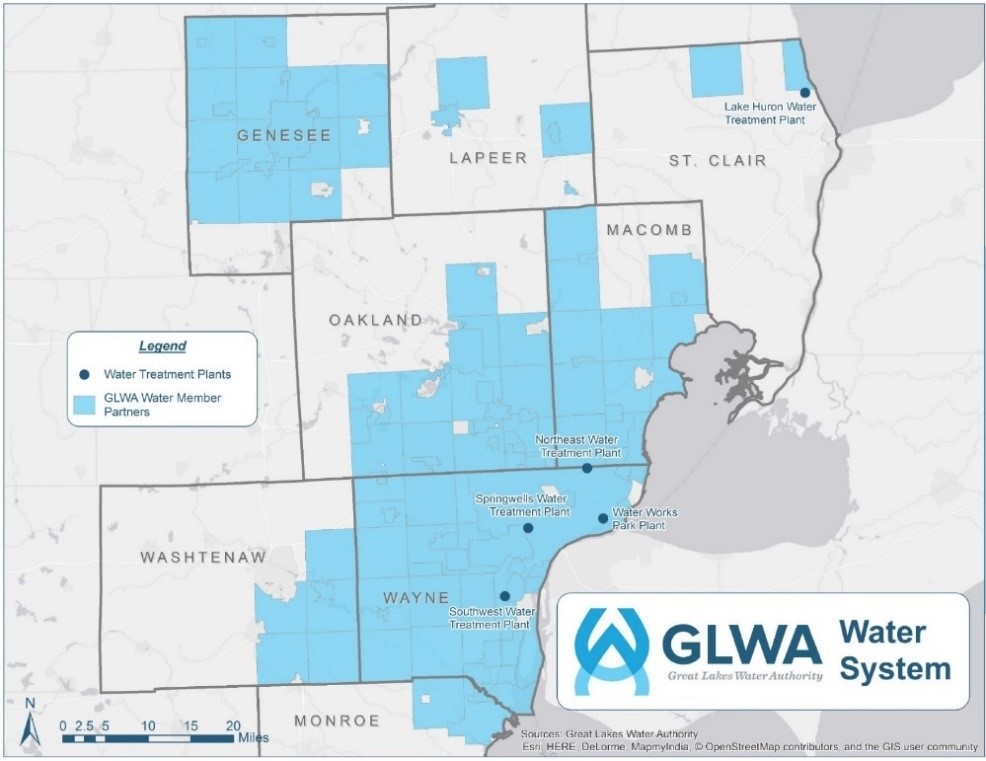
Image source: GLWA Year in Review, 2017
To apply place-based affordability metrics, the complex GLWA service area was created according to census geographical units. This analysis uses county subdivisions (census code 060) for community-to-community analysis, since Michigan is one of 12 states where county subdivisions are legal entities—as opposed to statistical areas derived by census bureau staff—that serve as local governments (called Townships or Charter Townships) similar to small cities or towns.72 This means that census cities, towns, townships, and charter townships directly correspond to legal cities, towns, townships, and charter townships that enter into wholesale utility agreements.
Analysis of economic and demographic factors takes place at a smaller resolution, using individual census tracts (census code 140) to identify more nuanced differences among groups within individual communities, akin to neighborhoods. Census tracts within the GLWA service area were computed using the MABLE/GeoCorr14 geographic correspondence engine.
Computation of Average Bills
Average per capita water consumption in the United States is estimated to be between 2,400 and 3,000 gallons per month.73 Average usage for the GLWA service area was computed using monthly service volume within Detroit (the jurisdiction with the clearest reported monthly service volume) divided by the number of households and the average number of individuals per household.74 The resulting per capita estimate was 2,640 gallons per month, squarely within the national average. Total average household monthly usage given the average family size of 2.675 is 6,864 gallons. This is roughly confirmed across GLWA, which reports average monthly usage for a family of three as 7,000 gallons.76
That monthly average was combined with individual community water rates per unit, wastewater rates per unit if applicable, fixed charges (water and wastewater), special charges (water and wastewater), and number of billing periods per year to compute average annual bills broken out by water and wastewater (see Appendix 1 for details). When billed by meter size, 5/8 connector (or smallest available) was chosen, as most residential meters are this size.
The image below shows average annual household water and wastewater bills for each community served by GLWA.77
Figure 14: Average Annual Household Water and Wastewater Bills (6,864 Gallons per Month per household)
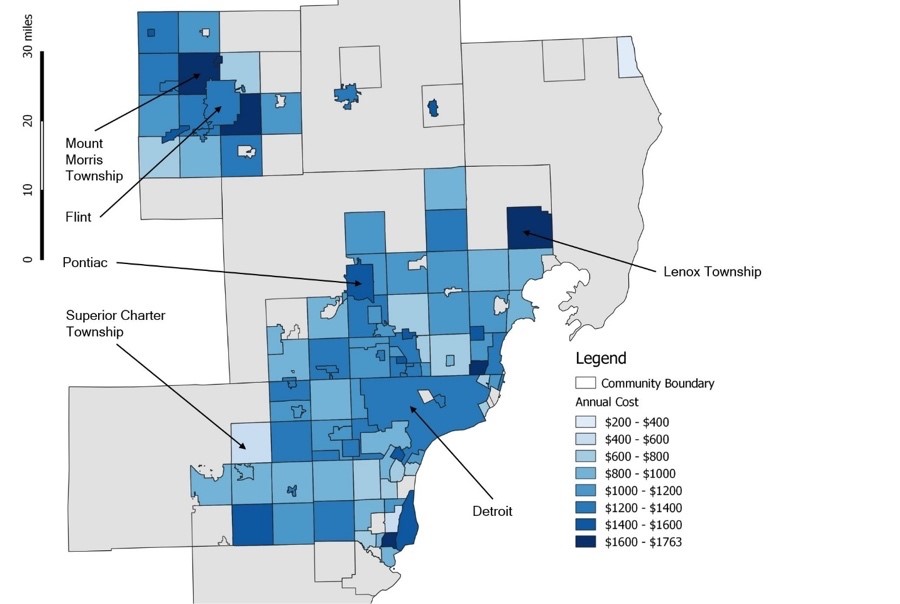
Average total annual bills for communities within GLWA range from $492.80 to $1,762.86, with wastewater costs typically $32.23 higher than water costs, although a portion of that for some communities could be attributable to wastewater infrastructure outside of GLWA management (see Appendix 3). The average annual total bill for Detroit is $1,246.51, with wastewater comprising 63 percent of that total bill. Aside from a cluster of relatively high costs in and around Flint, as well as a cluster of relatively lower costs south of Detroit, there are no clear spatial patterns to costs. Figure 15 below is a scatter plot showing annual water costs on the y-axis, median household income on the x-axis, and with each point representing a community scaled by the number of households.
Figure 15: Scatter Plot of Annual Water Costs, Median Household Income, and Number of Households
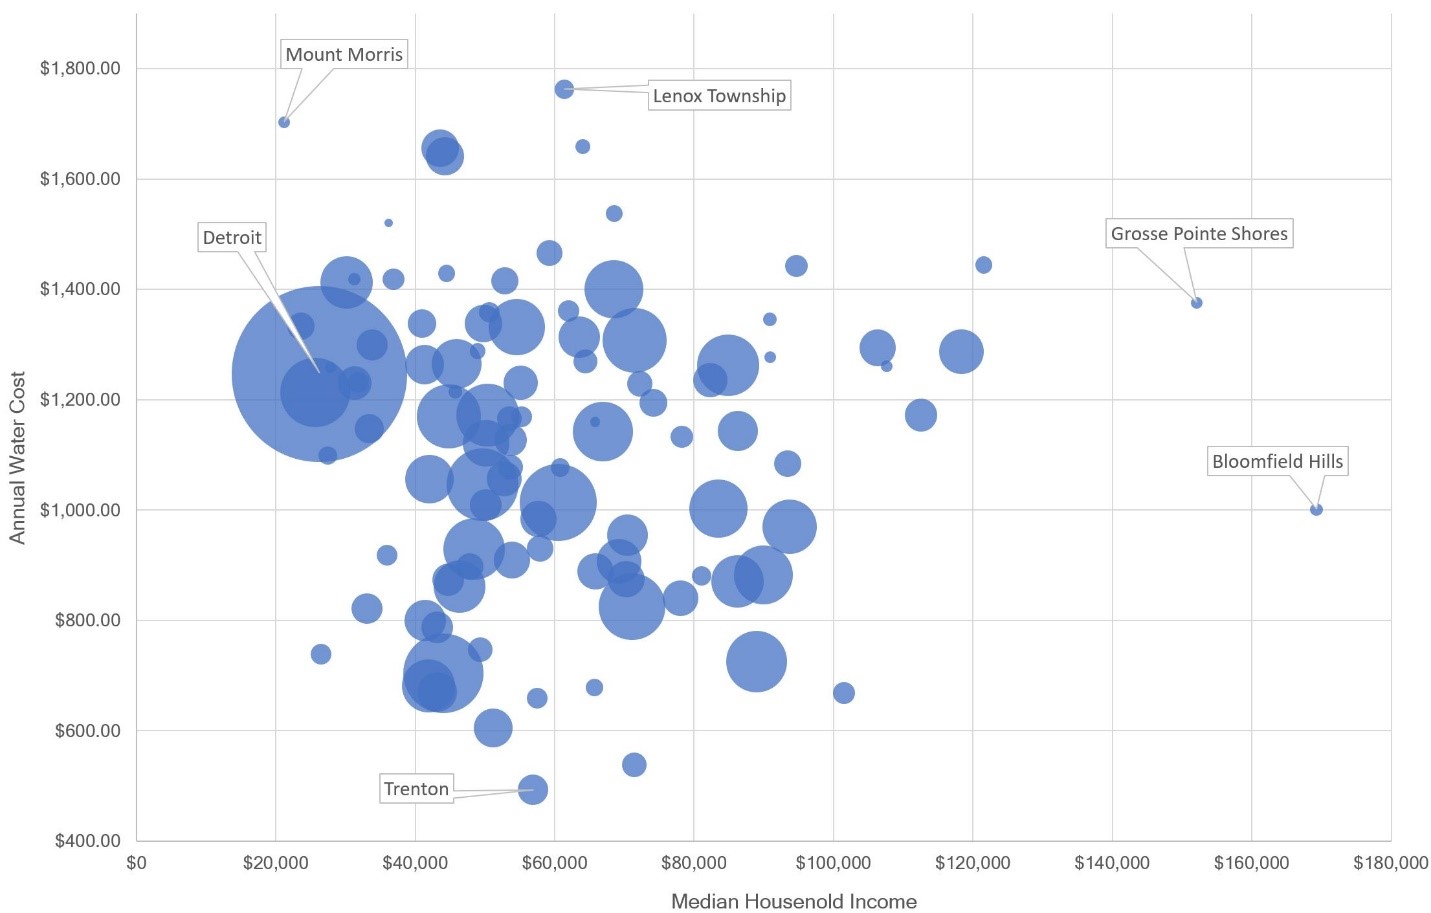
Image source: US Census, Individual local governments, author calculations
Aside from a few outliers within MHI, annual water costs, and number of households, there are no clear relationships or trends between any of the dimensions. If there were relationships between MHI, annual water costs, and/or number of households, a more linear pattern would emerge in the scatter plot.
Community Economic Characteristics
Median Household Income across the GLWA service area is represented below in Figure 16:
Figure 16: Median Household Income by Census Tract, 2016
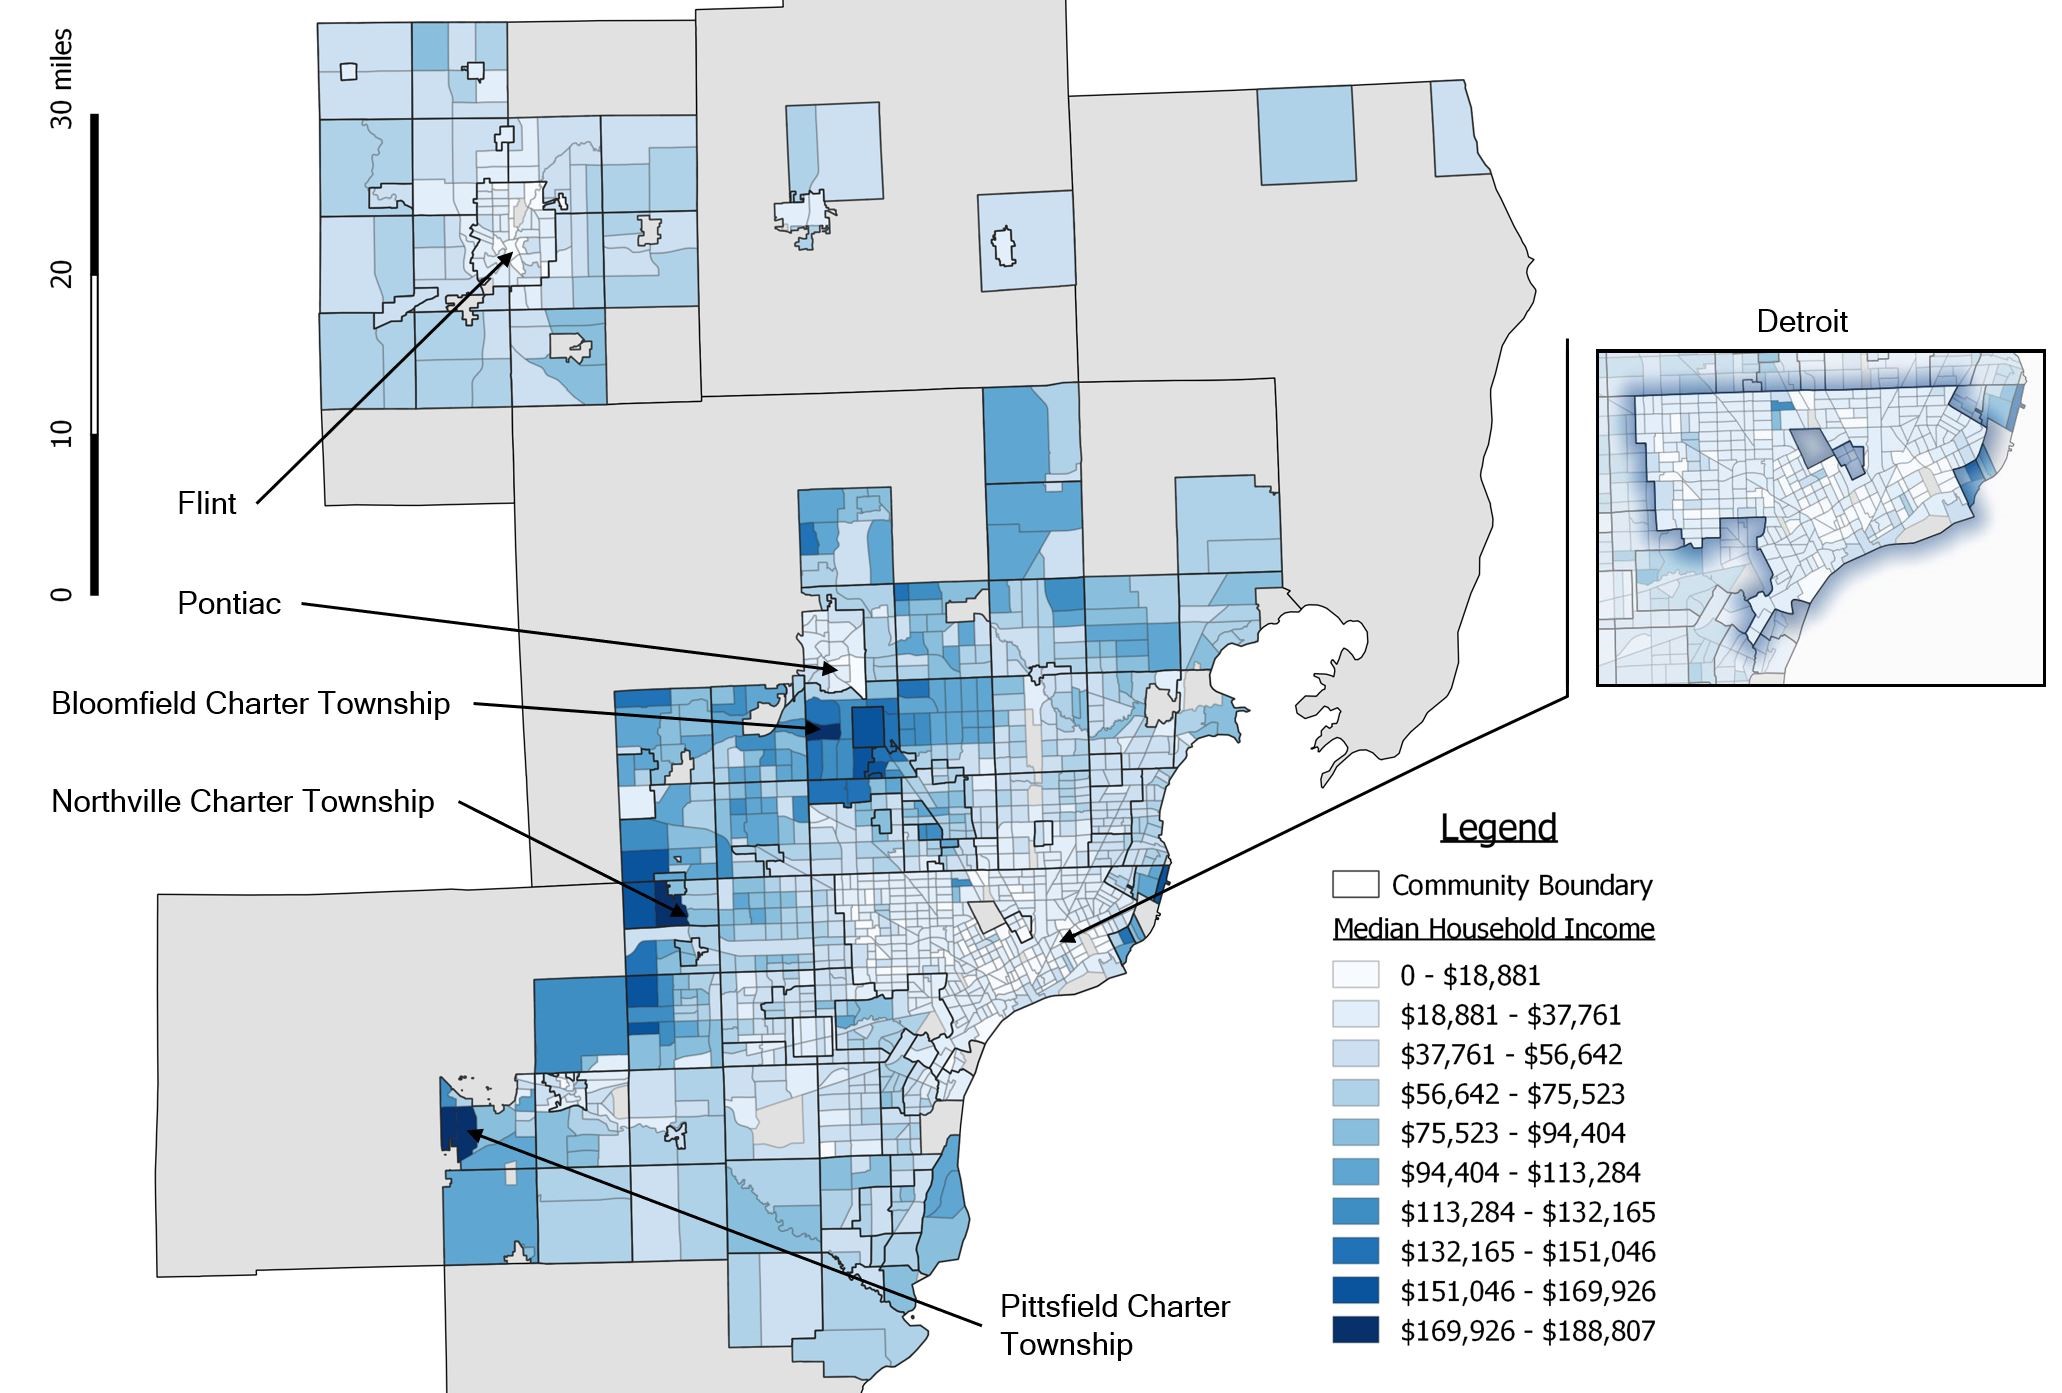
Image source: US Census Bureau
These data show patterns of low-income households in urban areas such as Detroit, Flint, and Pontiac, with higher-income areas encompassing the suburban areas between the urban centers, such as Bloomfield Township, Pittsfield Township, and Northville Township. Part of the reason for such patterns include the well-reported economic decline of Detroit and similar urban centers, as mirrored in unemployment rates seen in Figure 17 below.
Figure 17: Unemployment Rate by Census Tract, 2016
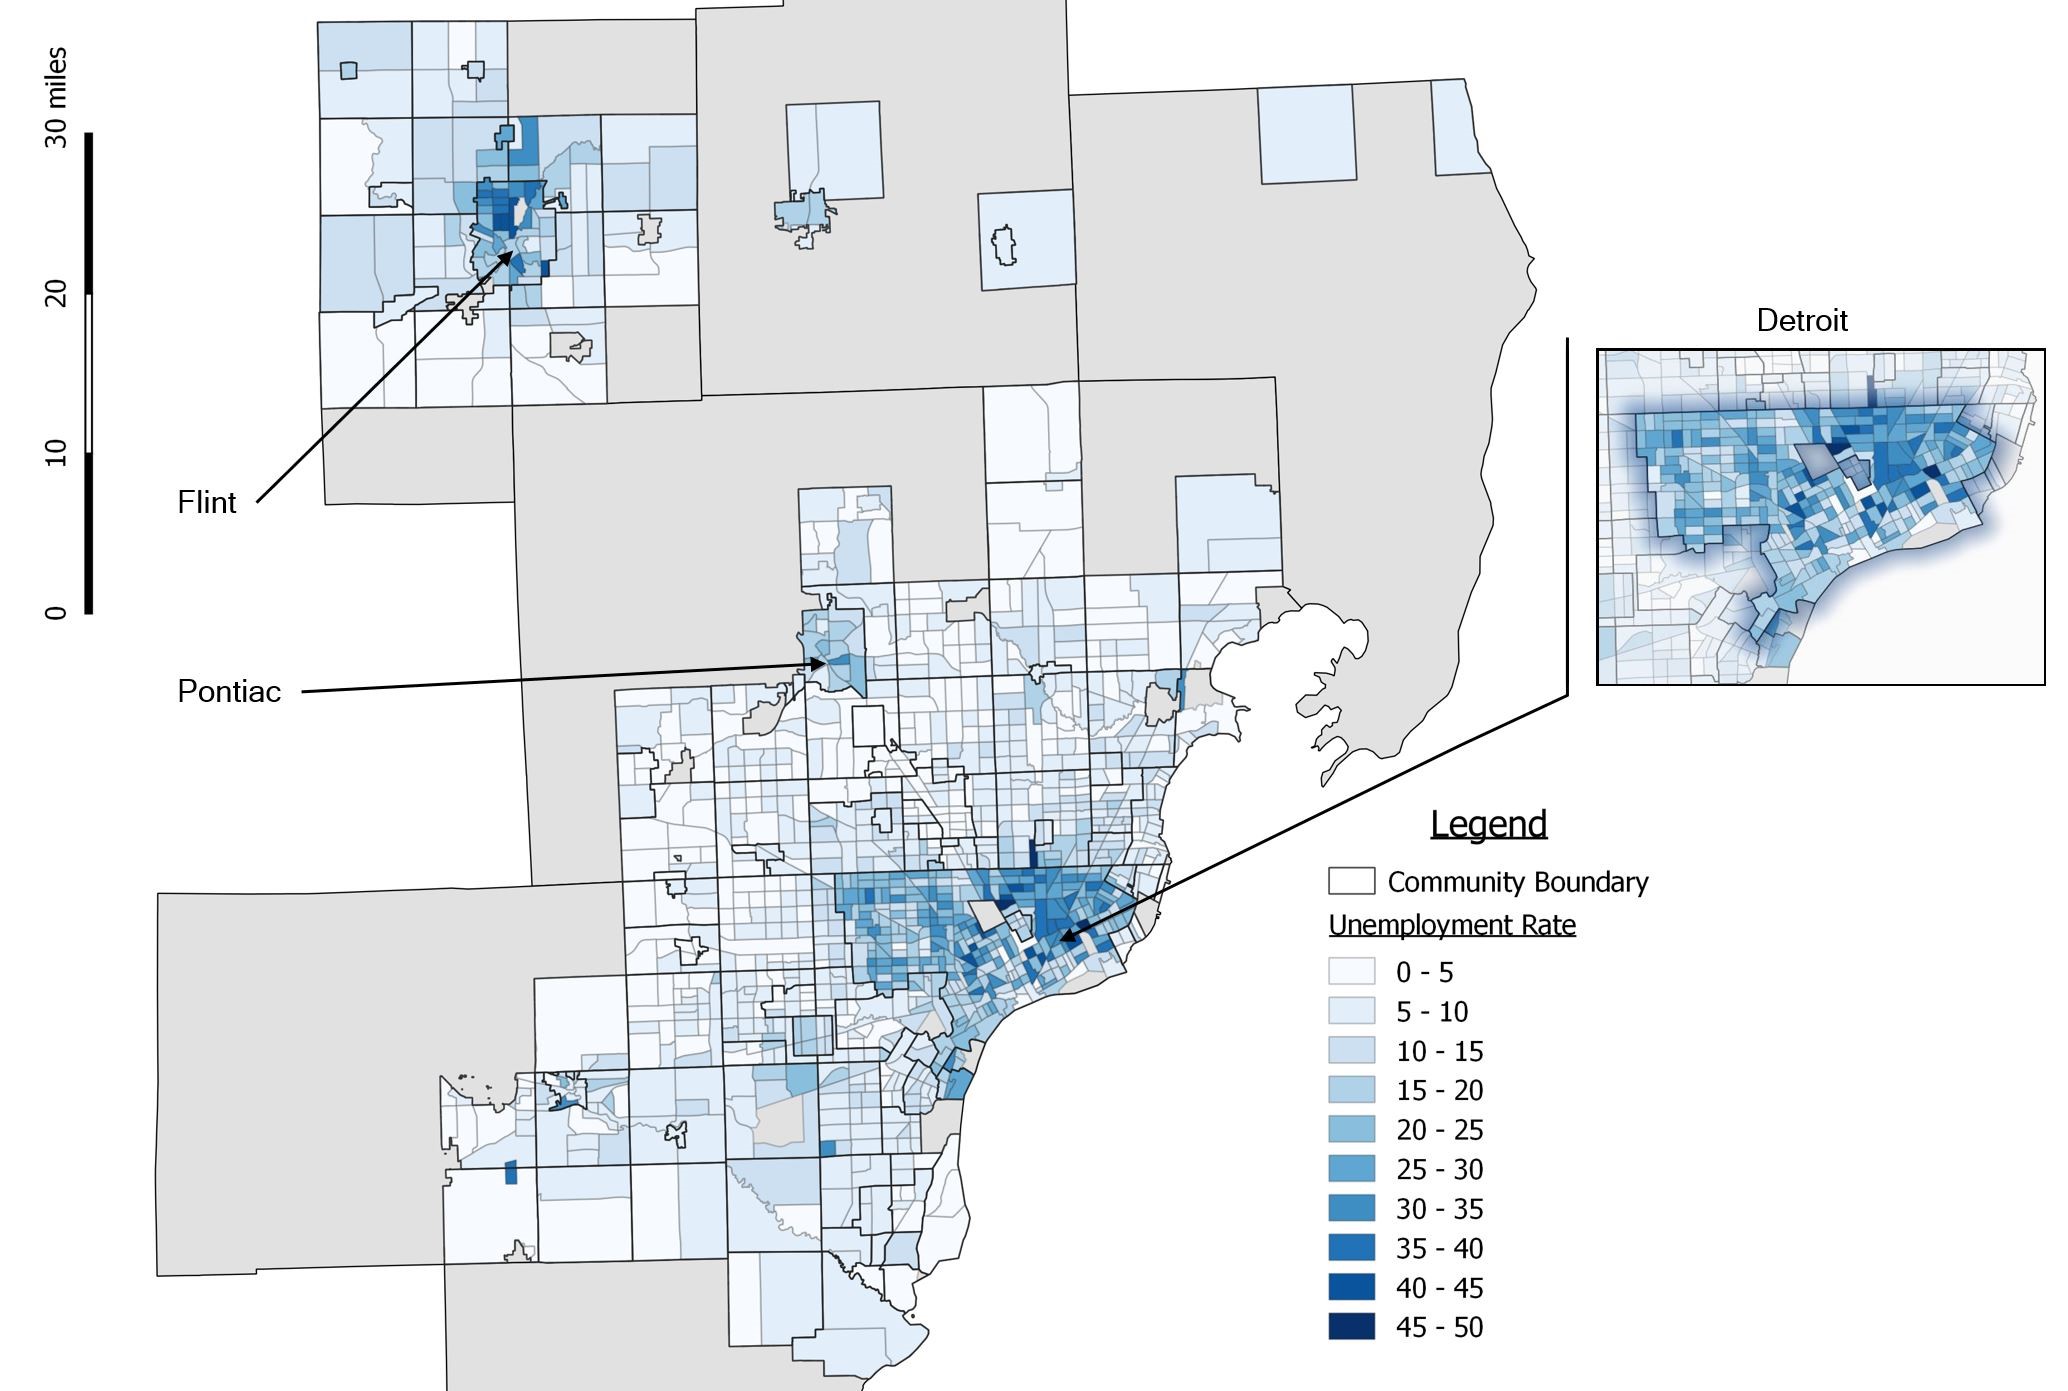
Image source: US Census Bureau
The data represented on these maps, and the map of annual water costs, are combined as inputs into the metric calculations shown in the results section below.
Results
Affordability Results of EPA Metric
Recall that the EPA’s RI for drinking water uses the median household income of nationwide small systems and an unaffordability threshold of 2.5 percent, while the RI for wastewater uses MHI for the system and an unaffordability threshold of 2 percent.
Individual community MHI within GLWA has a wide range, with a minimum of $21,196 and a maximum of $169,265. The EPA’s 1997 guidance instructs system-wide MHI be calculated from a weighted average that scales each community’s MHI by the proportion of total households it represents. GLWA’s weighted average MHI is $60,570.17, while Detroit’s MHI is $26,249.
Combining these inputs into the RIs yields an average combined water and wastewater result of 2.20 percent, a water result of 1.25 percent, and a wastewater result of 0.96 percent. The highest result was 3.52 percent, with the lowest being 0.97 percent (See Appendix 4 for full table), as seen in Figure 18.
Figure 18: EPA Metric Results
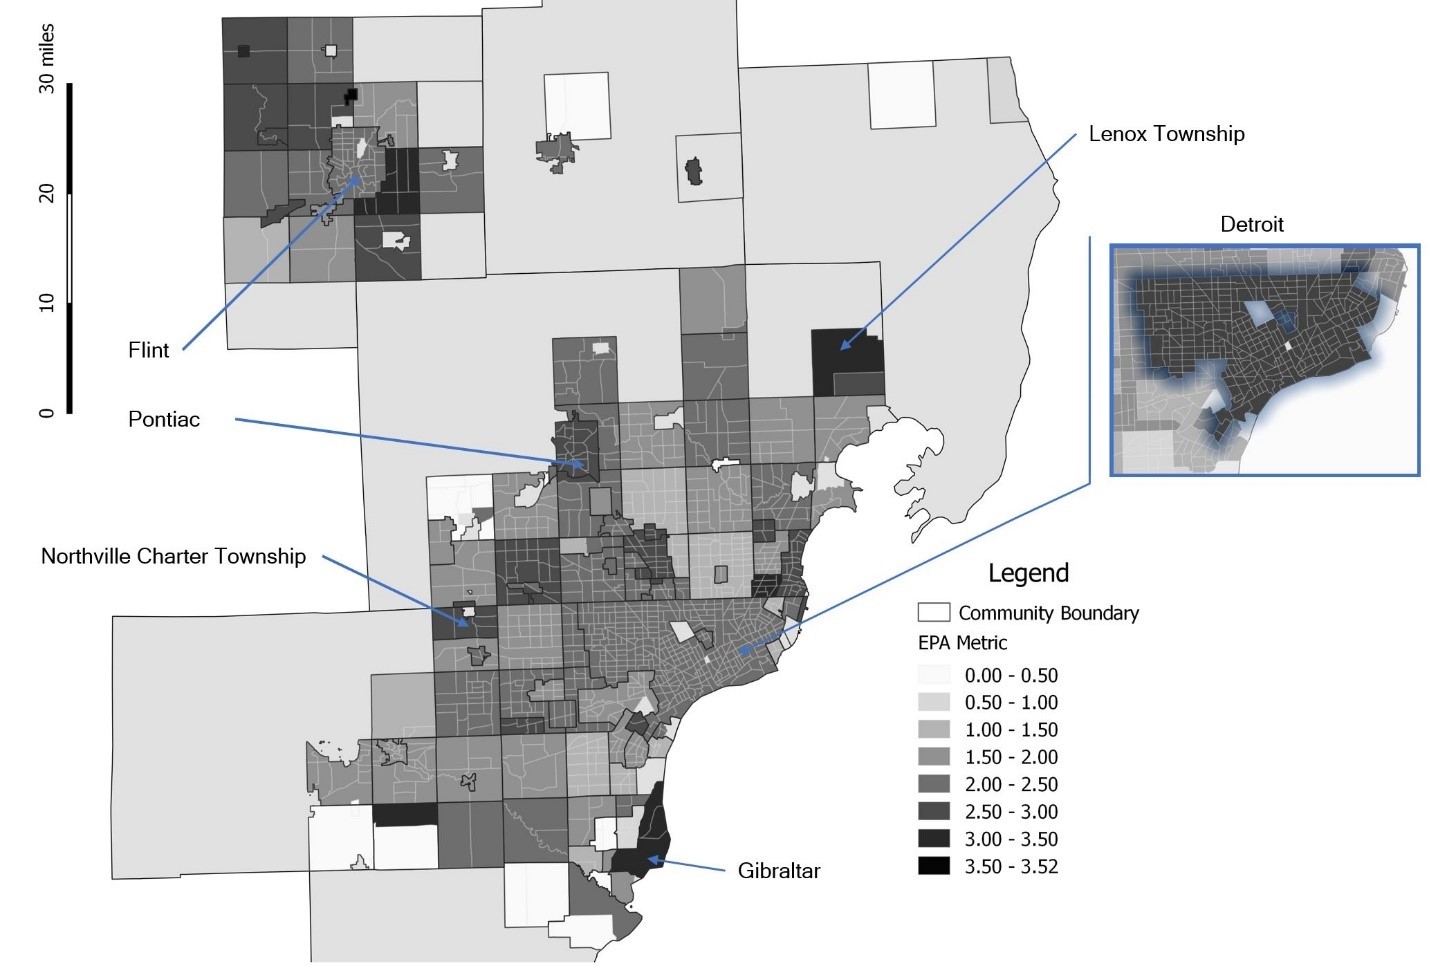
Image source: US Census Bureau, individual local governments, author calculations
Detroit, although found to have a higher combined water/wastewater percentage, is still deemed affordable at 2.35 percent, with water and wastewater individually at 1.05 percent and 1.29 percent, respectively.
Under the EPA’s current metric, no community or neighborhood is found to be unaffordable either in the total bill or water/wastewater component part.
Affordability Results of Two Alternative Metrics
Specification 1: Conservative Estimate (Local MHI)
This conservative specification of the alternative metric changes the EPA metric’s denominator from national small-system MHI for water and system-wide MHI for wastewater to local MHI for sub-populations within the service area for both. This amounts to a conservative estimate of affordability that does not radically challenge the EPA’s chosen threshold values, or even use the much-agreed-on need to focus on lower-income households. Since this model is conservative, a finding of unaffordability here means that the true extent of unaffordability is severe enough to show through a model that is still biased against revealing it. Figure 19 shows the results of the conservative alternative metric and highlights census tracts that breach the 4.5 percent combined water and wastewater indicator in yellow.
Figure 19: Conservative Alternative Metric Results (4.5 percent Combined Water & Wastewater Threshold)
Under this specification of the metric, unaffordability begins to appear at MHI below $31,300, as seen in Table 1 below.
Table 1: Communities Below $31,300 Median Household Income
| Name | Local MHI | Annual Water Costs78 | EPA Metric | Alternative Metric |
|---|---|---|---|---|
| Imlay City | $31,287 | $1,418.40 | 2.87 | 4.53 |
| Inkster79 | $31,285 | $1,230.58 | 2.29 | 3.93 |
| Pontiac | $30,152 | $1,412.52 | 2.81 | 4.68 |
| Royal Oak Township | $27,837 | $1,258.80 | 2.36 | 4.52 |
| River Rouge | $27,463 | $1,098.79 | 2.09 | 4.00 |
| Ecorse | $26,496 | $738.53 | 1.44 | 2.79 |
| Detroit | $26,249 | $1,246.51 | 2.35 | 4.75 |
| Flint | $25,650 | $1,213.53 | 2.45 | 4.73 |
| Hamtramck | $23,609 | $1,333.36 | 2.5 | 5.65 |
| Mount Morris | $21,196 | $1,702.71 | 3.52 | 8.03 |
It is notable that not only low-income urban areas face unaffordability issues. While the core urban centers and their neighboring communities of Mount Morris, Hamtramck, Ecorse, and River Rouge face unaffordability driven by a mixture of low incomes and high costs, the suburban communities of Inkster and Imlay City face very similar issues. Although they have the highest incomes of the locations that rise above the 4.5 percent threshold, they are only barely above 150 percent of the federal poverty level ($30,240 for a family of three), which is a common threshold for some public assistance benefits.80 Additionally, the communities of Lapeer, Montrose, Melvindale, Eastpointe, and Almont each face partial affordability for water or wastewater (rising above the threshold value for one of the two), even though their MHI rises above $31,300 (See Appendix 4 for full table).
In Detroit, 272,774 households reside within census tracts whose RI breaches the 4.5 percent threshold, representing households at risk for unaffordability. Of those households, 72,185 had annual household incomes under $29,999,81 making them extremely likely to face unaffordability. Within the rest of GLWA, 59,381 households are at risk, and 35,864 are extremely likely to face unaffordability.
When the metric is tailored to actual on-the-ground economic characteristics, unaffordability issues become clear, even under modeling assumptions biased against finding unaffordability.
Specification 2: Realistic Estimate (Local MHI and Focus on twentieth Income Percentile)
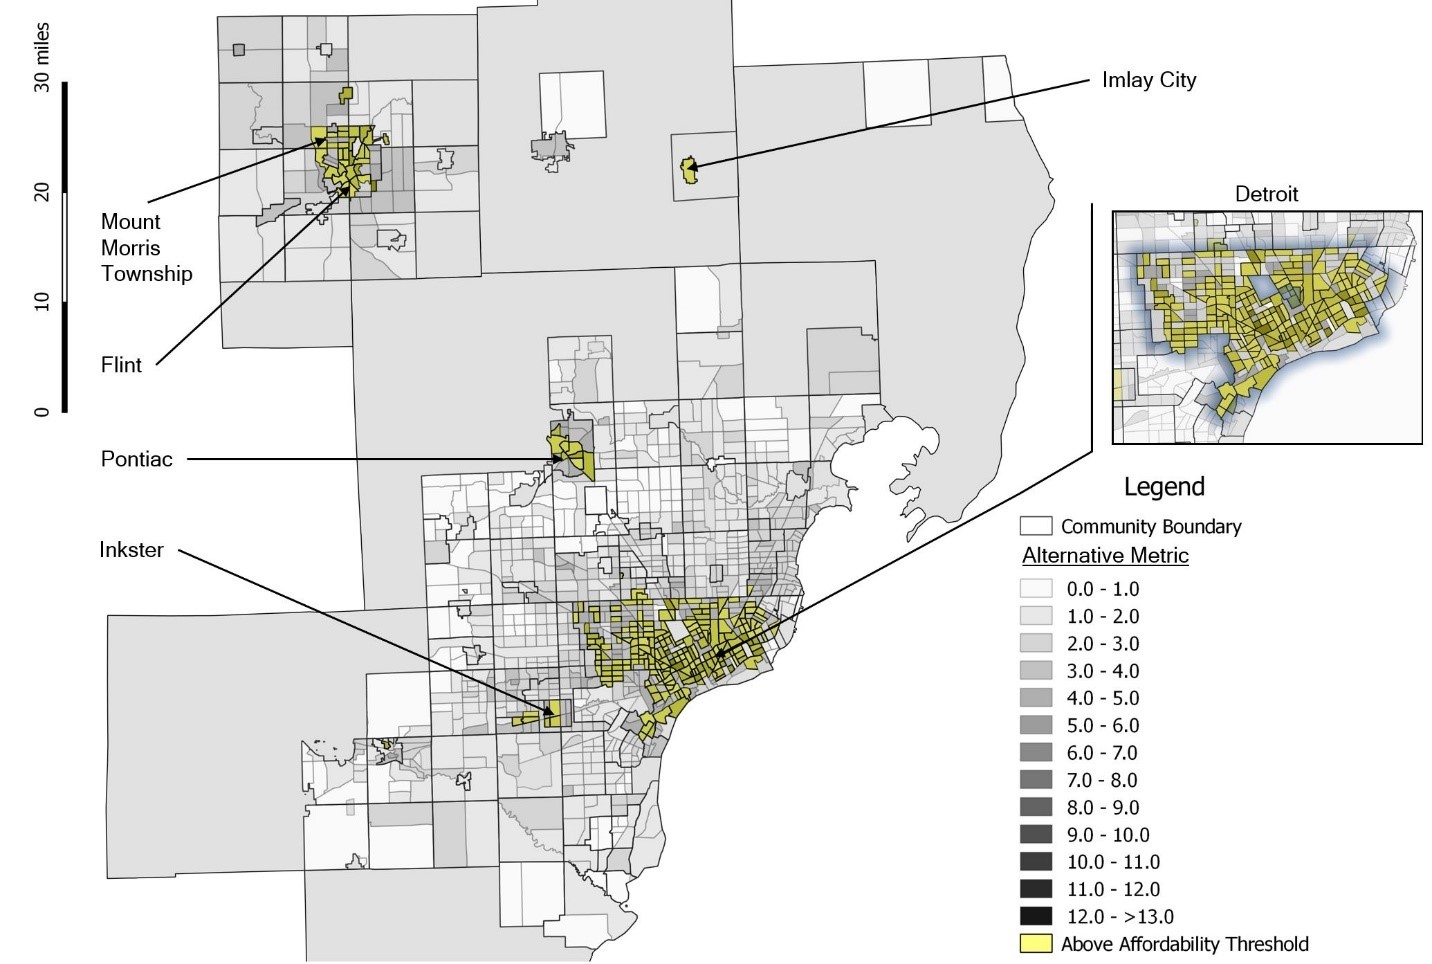
This realistic specification of the model makes the same changes to introduce local data for place-based analysis that the conservative specification made, but also shifts the focus of the denominator to the upper bound of the first quintile of the income distribution (twentieth percentile) as recommended by NAPA. This amounts to a more realistic representation of affordability issues that reflect struggles faced by households and also provides more accurate inputs for utility financial planning based on actual customer ability to pay. Figure 20 shows the results of the realistic alternative metric and again highlights census tracts that breach the 4.5 percent combined water and wastewater indicator in yellow.
Figure 20: Realistic Alternative Metric Results (4.5 percent Combined Water & Wastewater Threshold)

Image source: US Census Bureau, individual local governments, author calculations
It is worthwhile to note that a spatial component to the analysis is important since it reveals additional relationships that most tables alone do not. When communities that tip affordability thresholds are mapped, it becomes clear that “pockets of poverty”82 extend beyond impoverished urban areas, as well as smaller neighborhood-level pockets of unaffordability within communities.
Under the realistic alternative metric unaffordability issues again begin to arise around roughly $30,000 annual household income (except for Lenox Township, which has the highest annual costs of all communities). However, many more communities have twentieth percentile incomes below this level. Whereas the conservative metric found six communities to have RIs above the threshold, the realistic metric found 45 to be above the threshold. Table 2 below shows the upper five and lower five communities ranked by twentieth percentile income from this group (see Appendix 4 for full table):
Table 2: Selected Communities Above 4.5 percent RI Threshold Under Realistic Metric Specification
| Name | 20th Percentile Income | Annual Water Costs83 | EPA Metric | Alternative Metric |
|---|---|---|---|---|
| Lenox Township | $33,727 | $1,762.86 | 3.27 | 5.23 |
| Royal Oak | $30,520 | $1,400.01 | 2.57 | 4.59 |
| Clawson | $28,345 | $1,465.39 | 2.73 | 5.17 |
| Gibraltar | $27,458 | $1,658.89 | 3.15 | 6.04 |
| Montrose Township | $26,232 | $1,288.17 | 2.64 | 4.91 |
| ... | ... | ... | ... | ... |
| Inkster | $10,351 | $1,230.58 | 2.29 | 11.89 |
| Flint | $9,897 | $1,213.53 | 2.45 | 12.26 |
| Hamtramck | $9,818 | $1,333.36 | 2.5 | 13.58 |
| Detriot | $9,574 | $1,246.51 | 2.35 | 13.02 |
| River Rouge | $9,435 | $1,098.79 | 2.09 | 11.65 |
Under this specification, the previous trends around urban centers and their immediate neighbors remain, however, many more suburban communities—including communities far from urban centers—are found to face potential affordability issues since the metric is now calibrated to focus on the segment of the customer base where costs are more acutely felt.
In Detroit, 104,181 households are located within census tracts whose RI breaches the 4.5 percent threshold and have annual household incomes under $29,999, while the rest of GLWA has 204,308 households that fall under the same criteria. It is also important to note that although the number of communities found to face unaffordability pressures jumps by 650 percent, the number of households within each community represented in this metric specification only increases by 470 percent for GLWA and 44 percent for Detroit.84 This is because the conservative specification uses median household income, under which half of all households fall, whereas the realistic specification uses the upper bound of a single quintile for household income, which represents one-fifth of all households. Thus, although the geographic spread of unaffordability grows with this specification of the metric, the absolute number of households does not grow at the same rate.
This is precisely what this specification of the metric is meant to do: reveal the actual areas of unaffordability that are masked by aggregate median measures, but not to inflate the scale of the problem. The metric should reveal the extent of unaffordability pressures on households susceptible to such pressures but remain useful as a tool to utilities and regulators.
The EPA metric attempts to simplify review by using aggregate measures, but has been shown to mask unaffordability. At the same time, more accurate measures are shown not to be unnecessarily complex. Further, the accurate measures can be simplified in a number of ways as a final step to get a single system-wide number as an input for planning purposes. This feature was the original intent with the EPA’s original specification of the metric.85 For example, the new final stage of the RI could be the proportion of census tracts or communities system-wide that face unaffordability issues above the 4.5 percent threshold. This would essentially turn the current RI (after the adjustments to local MHI and twentieth percentile income) for each community into a first stage matrix that is then condensed into a new ratio of unaffordable census tracts to total census tracts as a final single-number output. This achieves the dual goal of making sure the metric accurately reflects the real-world information it is trying to convey, while still being simple enough to use as an input into complex planning models without being a burden on limited utility, community, or regulator staff resources.
When the metric is tailored to on-the-ground economic characteristics and the segment of the population most sensitive to unaffordability, the true scope of the problem is revealed and utilities are better able to plan accordingly in revenue requirement, cost allocation, and capital improvement planning calculations.
Distributional Impacts of Affordability Challenges
In addition to economic, cost, and population characteristics, it is important to know the demographic characteristics of populations facing unaffordability, especially if those populations are vulnerable in certain ways.86 A nationwide study of affordability found that census tracts with median incomes below $32,000 have higher percentages of disabled people, higher unemployment rates, higher levels of public assistance income, a higher incidence of sole female heads of household, larger percentages of minority residents, and lower rates of health insurance.87 87 Local stakeholders who have addressed affordability in southeastern Michigan have pointed to the lack of research on these particular issues, which this study attempts to rectify.88
As can be seen in the figures below, the nationwide trends are reflected in the Michigan data. Figure 21 shows the percentage of African Americans by census tract with tracts from the conservative specification over the 4.5 percent RI threshold (i.e., the extreme cases of unaffordability) highlighted in yellow. The correlation between the two is striking.
Figure 21: Census Tracts by Percent African American and Above 4.5 percent RI Threshold
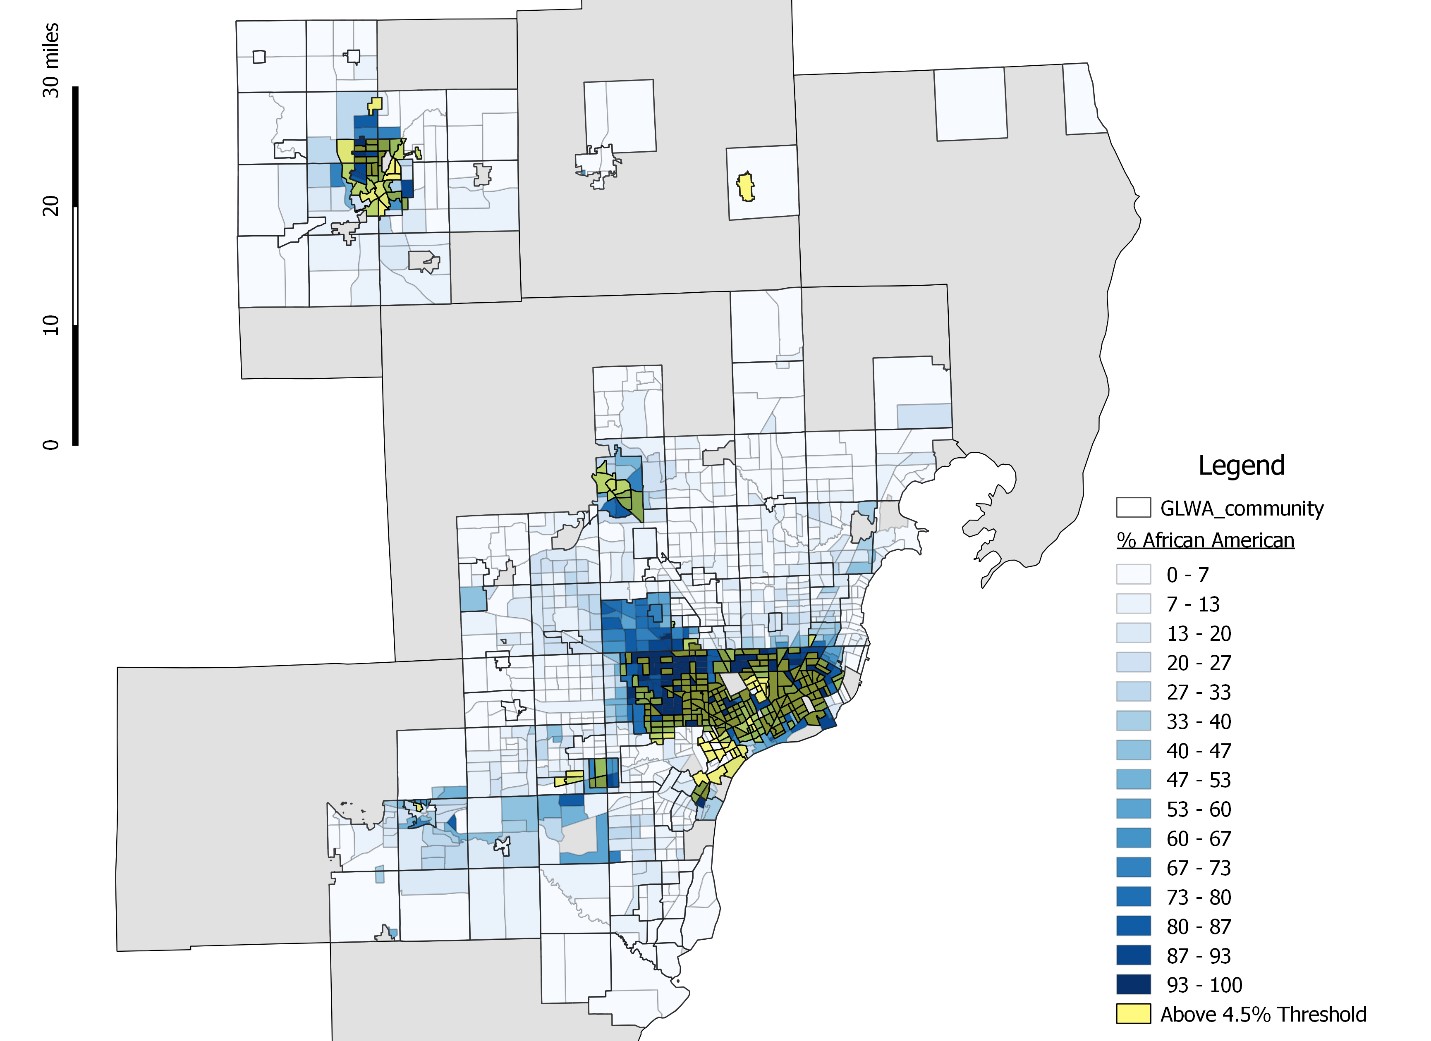
Image source: US Census, author calculations
Figures 22 and 23 below show the extent of public assistance89 used within census tracts and the census tracts that rise above the 4.5 percent affordability threshold evaluated at the twentieth percentile.
Figure 22: Census Tracts by Percent Receiving Public Assistance
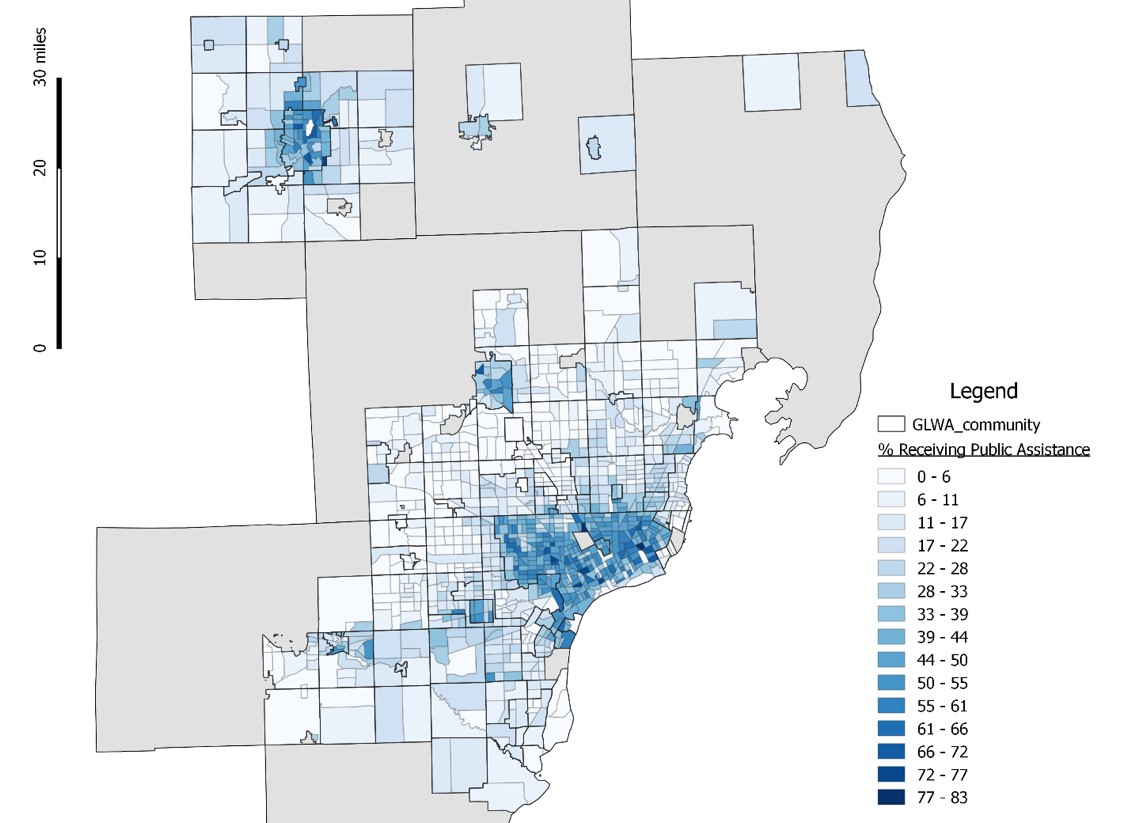
Image source: US Census, author calculations
Figure 23: Census Tracts by Percent Receiving Public Assistance and Above 4.5 percent RI Threshold
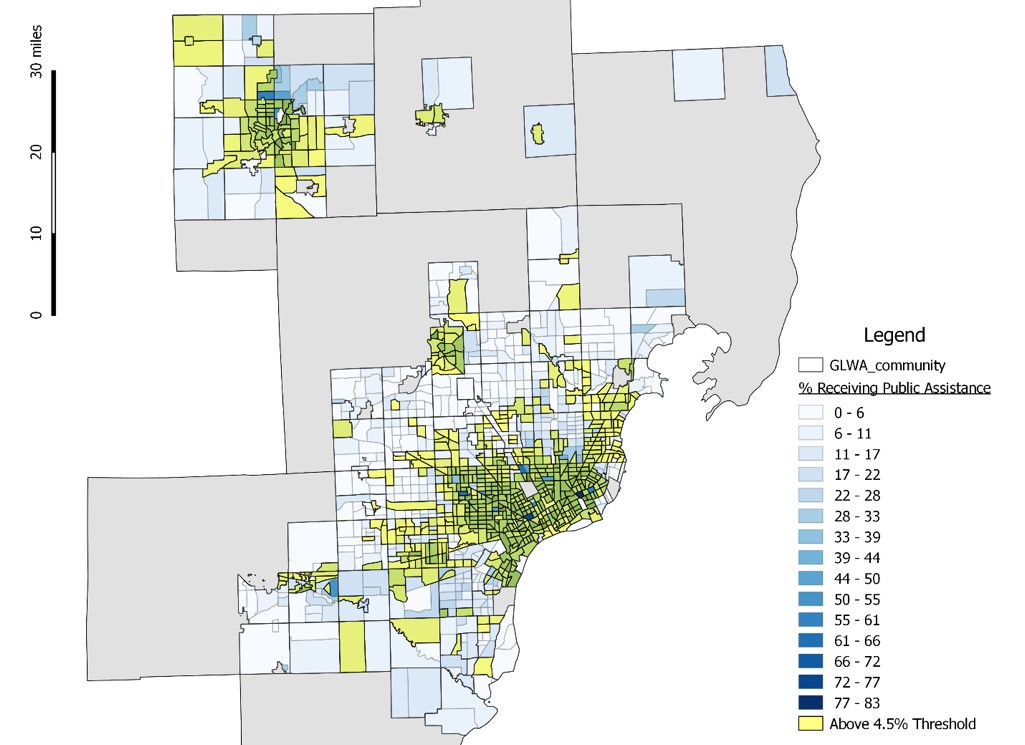
Image source: US Census, author calculations
Again, the connection between the two is visible, with the highest rates of public assistance occurring in and around the metro centers of Detroit, Pontiac, and Flint, but also spreading to the surrounding suburbs, especially towards the southwest, alongside the tracts that fall above the 4.5 percent threshold.
Lastly, similar comparisons can be drawn between the percentage of the population with a disability90 and the tracts that rise above the 4.5 percent threshold, as seen in Figures 24 and 25.
Figure 24: Census Tracts by Percent with a Disability
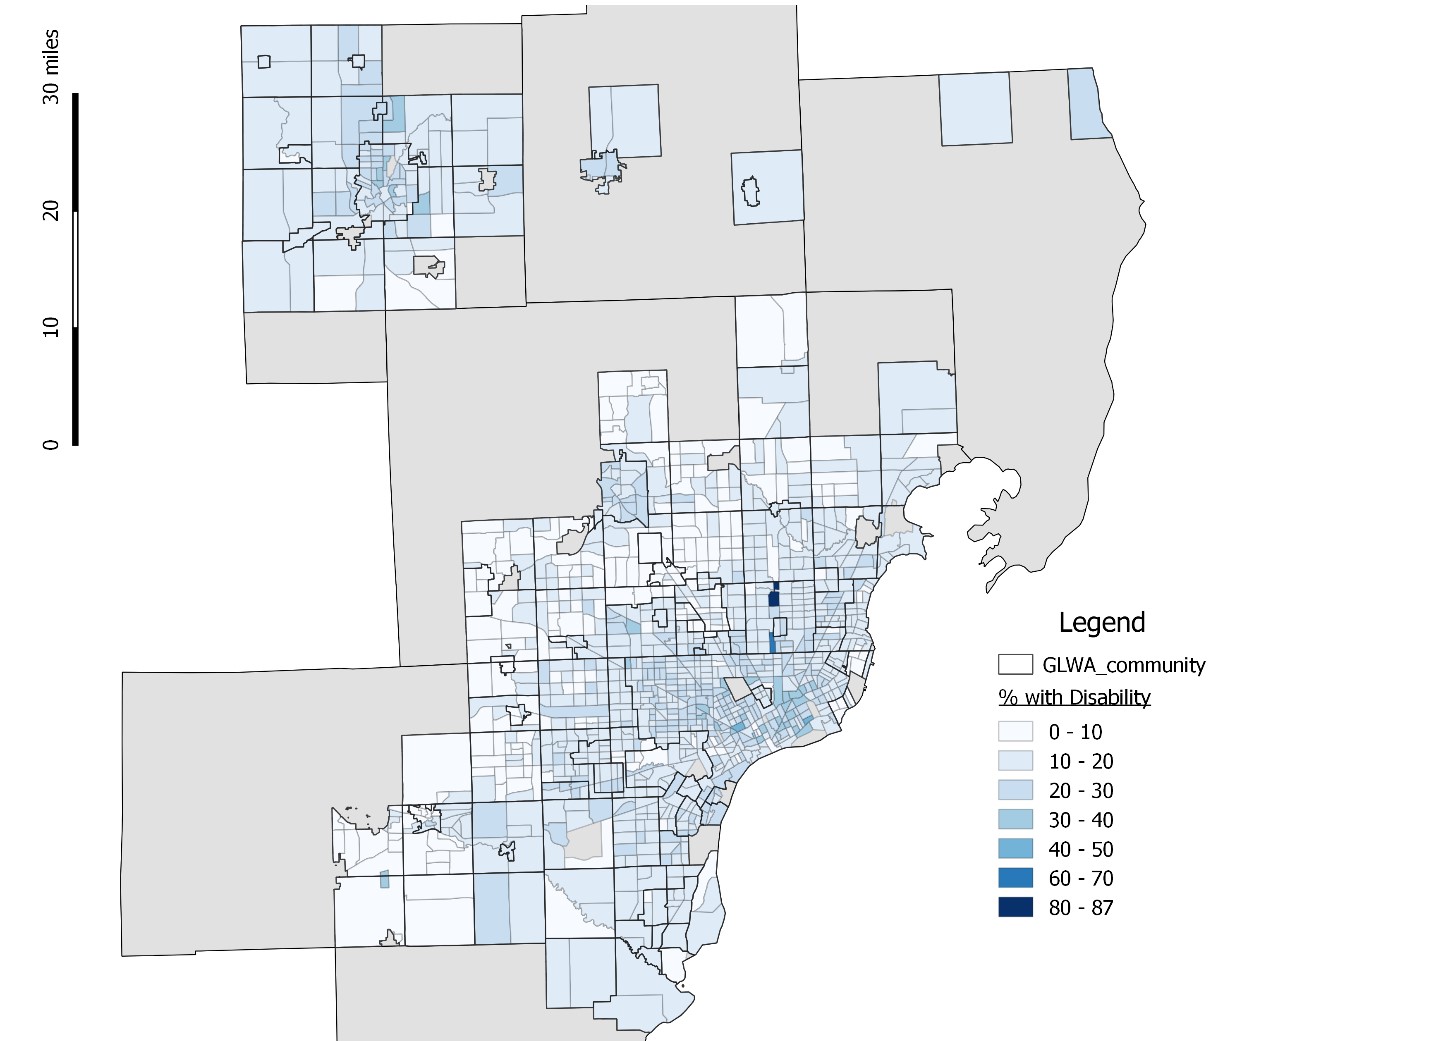
Image source: US Census, author calculations
Figure 25: Census Tracts by Percent with Disability and Above 4.5 percent RI Threshold
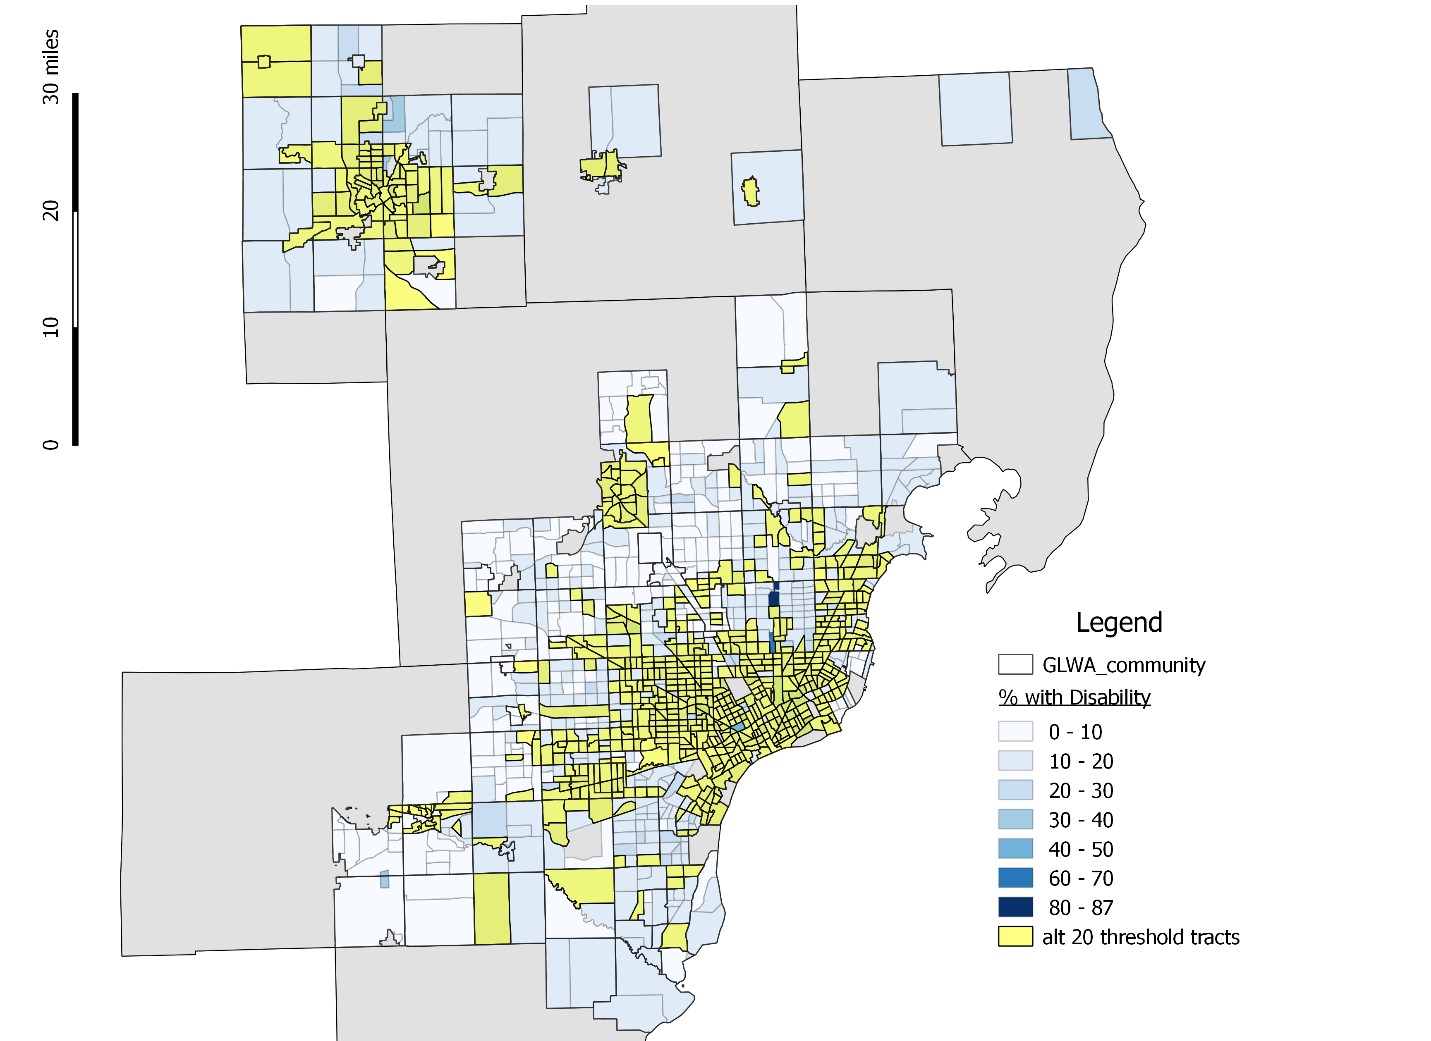
Image source: US Census, author calculations
Here, the connection between the two is less obvious, since there are more widespread lower percentages of disability across the region that is not limited to the tracts that breach the affordability threshold, but it is still clear that the areas suffering the most intense affordability issues are generally the places that have disability rates above 30 percent.
It is clear that water unaffordability disproportionately impacts already-vulnerable communities.
Trends Over Time
One of the common critiques of existing metrics is that they are static snapshots in time that do not take into account temporal trends. It is important to analyze how demographic and economic patterns shift over time to see what trends the near future may hold, especially when comparing different localities.
Figure 26, below, shows the population shifts in Detroit (a low-income urban center), Bloomfield Township (a high-income Pontiac suburb), Van Buren Township (a median-income Detroit suburb), and Harrison Township (a median-income township not located near an urban center). These locations represent a sample of different income levels and geographic identities, but still show clear trends.
Figure 26: Population Estimates 1990-2016
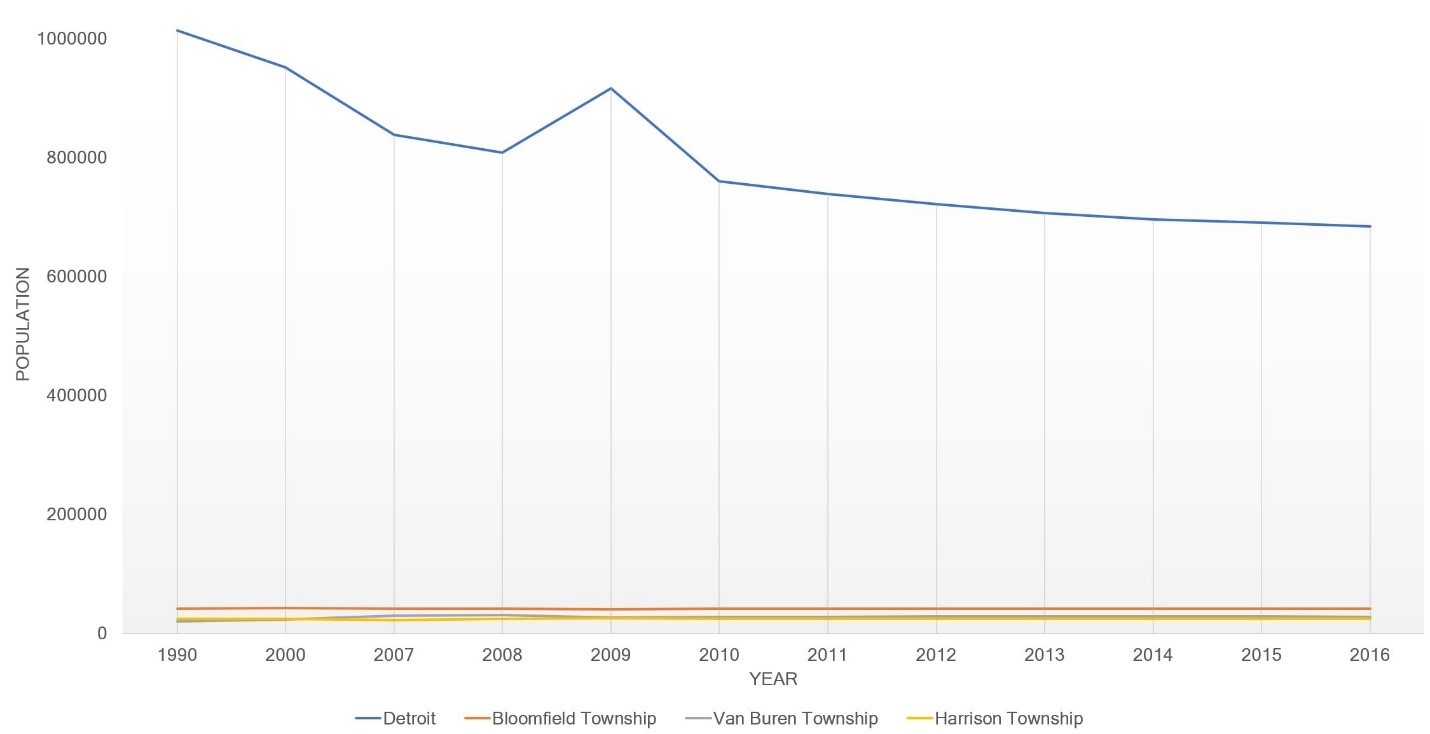
Image source: US Census American Community Survey 5-year estimates for 2012-2016, 3-year estimates for 2009-2011, 1-year estimates for 2007-2008, and decennial census for 1990-2000.
Detroit shows a steady and significant decline in population of over 300,000 people, while the individual suburbs grow slightly (Van Buren Township) or stay relatively stable (Bloomfield Township, Harrison Township).91
Figure 27 displays poverty rates among the locations over time.92 Although poverty rates climb for all locations in the aftermath of the Great Recession, only Detroit’s was climbing significantly beforehand, and again only Detroit’s shows minimal recovery after the nation’s economic turnaround.
Figure 27: Poverty Rate Estimates 1990-2016
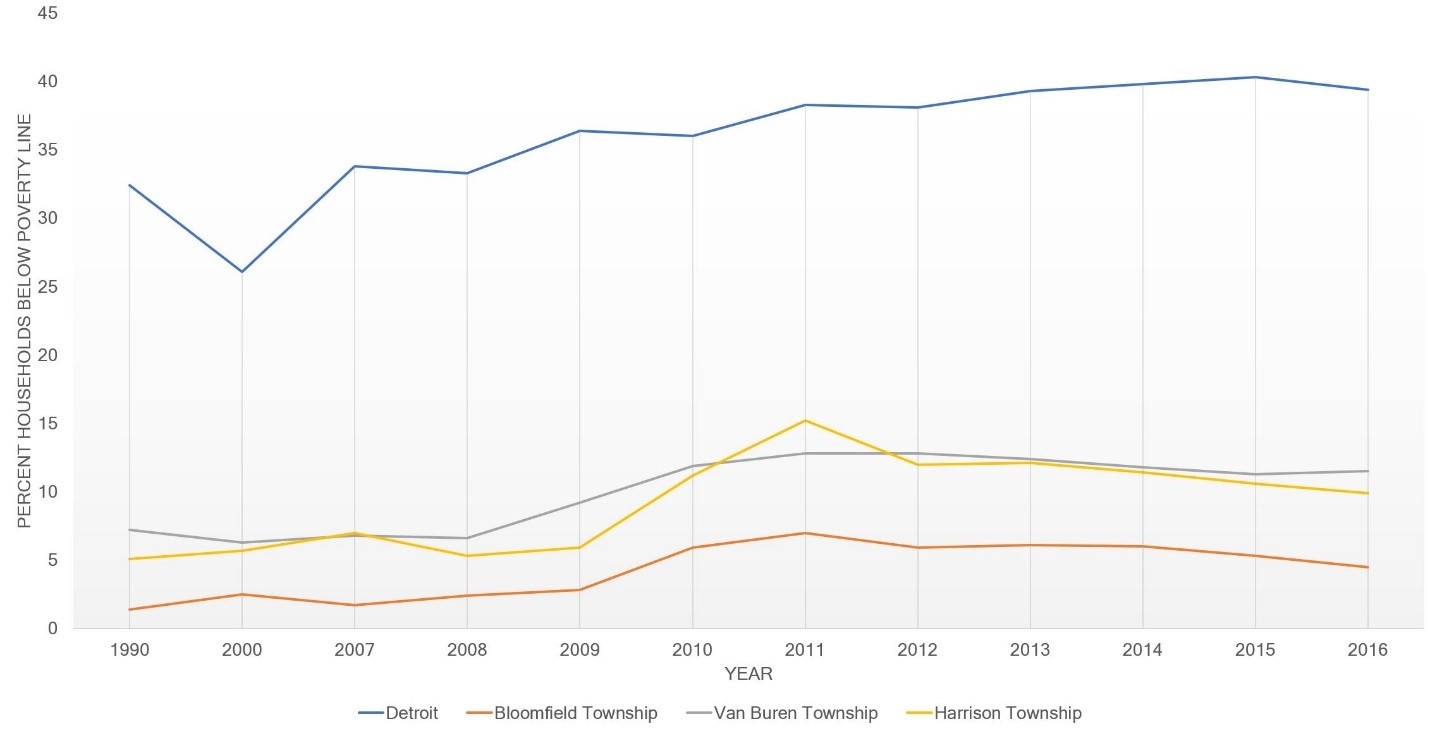
Image source: US Census American Community Survey 5-year estimates for 2012-2016, three-year estimates for 2009-2011, 1-year estimates for 2007-2008, and decennial census for 1990-2000.
It is clear from both trends that the economic and social pressures on utilities in struggling urban centers like Detroit (and by extension Flint and Pontiac) are not on a path to rectify themselves. Increasing poverty rates mean more households will face unaffordability concerns, while shrinking ratepayer numbers due to population decline will also put further strain on utilities that need to spread high fixed costs among a broad customer base.
Alternatives for Addressing Affordability
This section will present and evaluate possible policy options for alternative rate structures and customer assistance programs to address unaffordability issues from both equity (fairness, social impact) and efficiency (utility viability) perspectives. This type of policy discussion is necessarily defined by the unique circumstances of the utility service areas. The following discussion relates to the GLWA and DWSD, but can be read to follow the general principles of what alternative practices could apply elsewhere. Before analyzing alternatives for addressing unaffordability, it is necessary to understand the legal landscape that has characterized decision making and rate setting in Michigan.
Legal Context
State Law
When the question of water affordability plans and their funding is raised, the Headlee Amendment is brought up as a legal barrier to some proposals to create a robust affordability program. A full accounting of the state of cases on this topic is outside the scope of this analysis, but given the number of active cases and the variability in the outcomes so far, as well as conflicting legal memos to come out of official reviews such as the Detroit Blue Ribbon Panel on Affordability, it is clear that the Headlee Amendment and its application in Bolt do not outright prohibit alternatives to cost-based rate setting, and that each is subject to individual interpretation.93 The fact that the Detroit Blue Ribbon Panel on Affordability did not decide to find alternative rate structures unlawful, only subject to “risk of potential legal challenge,”94 illustrates this fact. Interviews with local experts and review of internal decision-making documents indicate that current lack of alternative rate structures is due to desire to avoid said potential legal challenge, rather than a past finding of unlawfulness.
Mich. Const. art. IX, § 31, commonly referred to as the Headlee Amendment, prohibits local governments from raising taxes without voter approval.95 In Bolt v. City of Lansing, the Michigan Supreme Court interpreted a storm water charge that exceeded the actual cost of service as a tax, invalidating it under the Headlee Amendment.96 The court devised a three-part test to differentiate between a tax and a fee, holding that:97
- A user fee is meant for regulation, while a tax generates revenues.
- A user fee must be proportionate to the necessary cost of service.
- Unlike taxes, fees should be voluntary, allowing users the right to refuse the use of a commodity.
The Detroit Blue Ribbon Panel on Affordability stated that the Bolt decision has generally been interpreted to require that water services be priced on the cost of service, rather than alternative rate structures potentially based on non-cost factors like income or ability to pay. However, there is considerable disagreement over the extent to which Michigan’s legal framework applies to alternative rate structures (as opposed to individual charges like the Bolt storm water charge).98
In July 2018, Oakland County Circuit Court Judge O’Brien ruled on a class action case brought on behalf of Bloomfield Township residents. The suit raised multiple issues, one of which asserted that some water and sewer service charges violated the Headlee Amendment. On this point, the judge ruled that there was no violation of Headlee.99
A series of other lawsuits in circuit court have had mixed results, with suits against Birmingham and Ferndale settling out of court and cases against Royal Oak and Holly dismissed in court in 2015 and 2016.100 A single law firm handled many of those cases and has several ongoing cases in Oak Park, Westland, Detroit, Dearborn, and Brighton Township.101 Oak Park has taken its case to the Michigan Court of Appeals.102
Federal Law
Beyond state law, federal laws and regulations expressly allow variable rate structures. EPA regulations state very clearly that grantees (local jurisdictions regulated by EPA) “may establish lower user charge rates for low income residential users after providing for public notice and hearing.”103 Further, EPA states that “[t]he costs of any user charge reductions afforded a low-income residential class must be proportionately absorbed by all other user classes. The total revenue for operation and maintenance (including equipment replacement) of the facilities must not be reduced as a result of establishing a low income residential user class.”104 In addition to regulatory permission, the EPA encouraged regional administrators and directors to consider alternative rate structures, saying that “[u]niform rate structures may place disproportionately high financial burden on households with low incomes. EPA Strongly encourages municipalities to consider establishing lower rates or subsidies for low income customers.”105 Therefore, the EPA not only allows, but expressly encourages, low-income alternative rate structures to be implemented, and to be paid for by spreading costs throughout the rest of the system’s ratepayers.
The Supremacy Clause of the United States Constitution declares that federal law supersedes state law when the two conflict.106 The United States Supreme Court has also clearly found in City of New York v. FCC that federal regulations, such as EPA’s, carry the force of federal law:
The phrase “Laws of the United States” encompasses both federal statutes themselves and federal regulations that are properly adopted in accordance with statutory authorization… we have also recognized that “a federal agency acting within the scope of its congressionally delegated authority may preempt state regulation” and hence render unenforceable state or local laws that are otherwise inconsistent with federal law.107
It has been asserted that because GLWA operates under an EPA NDLP permit and receives funding from EPA through State Revolving Funds, EPA regulations apply to the current context as interpreted by the Supreme Court in City of New York v. FCC. It is unclear if this avenue of argumentation has been raised any of the various state cases brought under Headlee/Bolt.
The active nature of state cases and potential avenues for higher level appeals, especially in the context of federal law, mean that the legal context of this topic is uncertain, and fear of legal challenge alone should not prevent further consideration of alternative rate policies, assuming that the long-term potential cost savings of rate reform are larger than legal fees.108
The federal government can also play a role in the design and implementation of affordability programs. For example, on June 6, 2018, Senator Kamala Harris introduced Senate Bill 3015, known as the Water Affordability Act. It would amend the Federal Water Pollution Control Act “to establish a low-income sewer and drinking water assistance pilot program...109 to provide grants to not less than 10 eligible entities to assist low-income households and environmentally at-risk households in maintaining access to sanitation services and drinking water.”110 The bill spells out qualifications for eligible entities and households. Eligible entities must be a municipality or public utility currently “affected by a consent decree.”111 Individuals eligible to receive assistance funded by federal government must be low-income (households at a particular income or enrolled in a number of existing assistance programs), or environmentally at-risk households in areas within 5 miles of an environmentally hazardous site or other area designated as at-risk by the EPA’s Environmental Justice Screen Tool, which uses both racial demographics and environmental risks.112
Policy Alternatives
One way that utilities address affordability issues like those identified above is through Customer Assistance Programs (CAPs). The EPA has published a review of CAPs across the country and found that programs typically span five categories:113
- Bill Discount – reduces the bill, typically long-term
- Flexible terms – arrearage management, bill timing adjustment, payment plans, levelized billing (breaking annual or quarterly payments down to monthly)
- Lifeline rate – subsidized rate for a fixed amount of water for basic needs
- Temporary assistance – short-term or one-time assistance to prevent disconnection or assist with hardship
- Water efficiency – provide assistance for repairs and/or efficiency upgrades
Out of 795 utilities reviewed by the EPA, 228 offered some form of CAP.114 The EPA found that 42 percent of all CAPs were related to bill discounts, while 27 percent were included in flexible terms, and 24 percent applied for temporary assistance. Programs are often targeted based on income, permanent disability, temporary hardship, age, or veteran status.
In late-2015, the Detroit City Council convened a Blue Ribbon Panel on Affordability (BRPA) to study the issue. The panel was comprised of national and regional experts on public utilities, water, and affordability who came from academia, regional utilities, and practitioners. The panel published a report in 2016 detailing its findings.115 Because the panel spent considerable time investigating and ranking policy alternatives, this analysis will not repeat those efforts in full.
However, the panel’s report exposed serious disagreements among members,116 shortages of data and analysis,117 and was published before GLWA’s program meant to address affordability was launched.118 So far, this analysis has endeavored to provide additional data and empirical analysis to inform areas where BRPA and others have admitted open questions remain. The review of alternatives below will report on BRPA’s findings, adding new empirical evidence from the findings in preceding sections and evaluating GLWA’s assistance program that the panel was unable to review.
Customer Assistance Programs
The Water Residential Assistance Program by GLWA and DWSD
GLWA implements a CAP called the Water Residential Assistance Program (WRAP). Eligibility requirements for the program are:119
- Have income at or below 150 percent of the poverty threshold ($30,240 for a family of three)
- Install a new automatic meter-reading device
- Provide proof of residency and income
- Provide renter’s proof of responsibility for water on lease
- Have provided payment towards the account balance (either of 5 percent of amount owed or $50) within last 90 days
- Stay current on monthly bill payment
- Two-year limit to program participation
The benefits of the program to households are:120
- One-time home water audit for households above 120 percent of average water use
- Up to $1,000 for minor plumbing repairs
- Up to $300 per year in monthly bill credits ($25 per bill)
- Up to $700 per year in arrearage assistance
WRAP is funded by GLWA at a rate of 0.5 percent of budgeted revenues, with initial funding of $4.5 million for FY2016 (first year of the program), $4.7 million for FY 2017, and $4.9 million for FY2018.121
As of December 31, 2017, 68 of 103 eligible communities have opted into WRAP. Statistics on uptake rates in each community are not publicly available, as program implementation is reported in aggregate dollar amounts rather than household-level accounts and WRAP is administered by four different “community action agencies,” but Detroit’s program is reported to have served 8,000 households since March 2016, with 3,557 households currently enrolled.122 Detroit is also the largest community user of WRAP, with $297,856 allocated to conservation and $1,278,103 allocated to direct assistance in fiscal year (FY) 2017.123 This is larger than the nearest county-wide allocation (Wayne County minus Detroit) at $188,029 for conservation and $806,833 for direct assistance. The rest of this WRAP analysis section will focus on Detroit, given the size of its WRAP allocation and the dire needs of Detroit identified in the preceding section.
Limits of Available CAPs
Despite being touted as “extremely successful”124 and “comprehensive”125 by the GLWA and outside groups, internal documents from the GLWA paint a different picture. The WRAP Program Design Report notes that economic challenges faced by customers are major:
These needs extend well beyond the scope of the Water Residential Assistance Program…the scope and structure of [WRAP and possible assistance programs] pales in comparison to the endemic problems induced by persistent poverty in our communities.126
Additionally, the report acknowledges that WRAP is not intended to be comprehensive:
WRAP will provide support to a select number of families in need. Preliminary estimates indicate that 2,000 to 5,000 households will be provided assistance each year under WRAP…Assistance programs—implemented by GLWA and regional retail service partners—must therefore be regarded as limited, often frayed, threads in a social safety net that is tattered in many southeastern Michigan communities. WRAP and similar programmatic efforts offer stopgap measures that, at best, may contribute to residents’ abilities to establish pathways to economic stability.127
It must be noted that despite the size and laudable efforts of the GLWA’s CAP, the design of WRAP has several structural design choices that severely limit its ability to provide real impact:
- The two-year participation cap means that WRAP falls under the category of “temporary assistance,” rather than “bill discount,” which means that it does not address the demonstrated structural affordability issues that households, especially in Detroit, face. It will provide relief to households for two years and will address accounts in arrears, but nothing inherent to the program (aside from reduced water consumption through leak fixes and efficiency upgrades) will prevent households from eventually falling into arrears again after the eligibility cap is reached
- The fact that arrearages receive over twice the subsidy that current bill amounts receive ($700 per year vs. $300 per year) means that WRAP is more focused on assisting the GLWA in removing past due accounts, rather than addressing the current demonstrated affordability concerns. Reducing the backlog of arrearages is indeed necessary, but this characteristic of the program does not address the fundamental structural forces that lead to arrearages in the first place
- The requirements that a customer must have provided a minimum payment towards arrears in the past 90 days and stay current on monthly bills means that a significant but unknown population will not be able to partake in the program, despite likely being the neediest of the needy
- The parts of the program focused on reduced consumption (via usage audit or plumbing repairs) may assist customers in facing lower bills, but the accompanying reduced overall consumption and corresponding reduced revenue harms GLWA’s (or the local community’s) ability to fund the program and other capital investment costs
According to the American Community Survey's 2016 five-year census estimates, 140,469 households within Detroit fall under WRAP’s income eligibility threshold of 150 percent of the poverty line ($30,240 for a family of three). Limiting that number to owner-occupied units128 yields an estimated 67,674 households129 that have need for and would be income-eligible for WRAP.130 The 8,000 households already served indicate that WRAP has only touched (temporarily, given the two-year cap on benefits) 11 percent of the estimated actual need within Detroit.
Detroit residents also have access to additional CAP programs funded outside of GLWA and run by volunteers or the state of Michigan. These include:
- DWSD 10/30/50 Plan:131 a payment plan that spreads out arrearages over a longer time period to prevent immediate water shutoffs. A down payment of 10 percent of the current past due balance allows a customer to spread the remaining balance over a 24-month period. Missing one payment while enrolled requires a payment of 30 percent of the remaining balance to re-enroll and missing a second payment triggers a requirement of payment of 50 percent of the remaining balance to remain enrolled
- Water Access Volunteer Effort (WAVE) Fund:132 a nonprofit 501(c)3 organization founded in 2003 that provides emergency assistance to low-income households facing crises. The organization pays dollar amount needed to restore or maintain water (up to $500) for households that have had the water shut off or have received a shutoff notice. Assistance is limited to once per calendar year and is contingent on the household paying any remaining balance to DWSD.
- State Emergency Relief (SER) program: provides up to $175 per year in assistance to prevent water shutoffs for low-income households.133 The emergency “must threaten health or safety and… must be one that the payment can resolve and one which is not likely to happen again.”134
- Soldiers and Sailors Relief / Michigan Veteran Trust Fund:135 provides financial assistance to indigent veterans, military spouses, widow/widowers, or children of a war-time veteran. Assistance amounts vary
Given the current WRAP spending levels within Detroit and the number of households reached, it is clear that the WRAP Program Design Report was correct in asserting that WRAP is a stop-gap measure that plays a small but important role in addressing affordability, but is by no means comprehensive. Detroit residents do have access to additional CAPs beyond WRAP at both the state and local levels. However, each is severely limited in its own right, whether by funding (WAVE), eligibility restrictions (SER), personal characteristics (veterans programs), or lack of actual financial assistance (DWSD 10/30/50) and unlikely to fundamentally address the systemic drivers of unaffordability. These CAP programs are essential to assisting households with temporary “crises,” such as sudden healthcare costs or loss of a job, but are not designed nor sufficiently resourced to address structural lack of affordability.
Using the number of households that fall below WRAP’s income eligibility threshold of 150 percent of the federal poverty line ($30,240 for a family of three) calculated in the prior Analysis section and extrapolating WRAP cost per household from the Detroit data,136 it is possible to estimate the funding needed for WRAP to fully address the affordability problems across GLWA in the absence of any other policy change. Table 3 below shows the estimated amounts per year that would be needed to address the upper and lower bound estimates (based on the realistic and conservative specifications of the metric, respectively) of the number of households in each service area:
Table 3: Total Estimated Cost for WRAP Alone to Meet Unaffordability Needs
| Number of Households | Total Estimated Cost | |
|---|---|---|
| Lower Bound Detroit | 72,185 | $31,977,955 |
| Lower Bound GLWA | 35,864 | $15,877,752 |
| Upper Bound Detroit | 104,181 | $46,152,183 |
| Upper Bound GLWA | 204,308 | $90,508,444 |
Given the current WRAP funding of $4.7 million for FY17 and the future yearly funding allocation of 0.5 percent of budgeted revenues, it is highly unlikely that WRAP alone would be sufficient to address the total need, even with additional infusions of funding.
Alternative Rate Structures
Alternative rate structures are another common way to address affordability concerns. These programs structure rates according to certain criteria so that different categories of customers pay varying amounts based on criteria inputs. A 2016 EPA survey of 795 utilities found that 228 offered some form of alternative rate structure.137
Income-Based Rate Setting
Income-based rate setting establishes costs for low-income households expressly on their ability to pay by setting rates as percentages of their income, in essence applying the metrics outlined above on a household-by-household basis. This type of rate has the benefit of targeting relief directly at those in need, which across-the-board discounts do not.138 Using a fixed credit approach in applying such rates would allow the program to work within a fixed and predictable operating budget. Drawbacks in the context of DWSD would be technical and staff limitations due to the need to redesign computer systems and business practices, which have been noted to be challenging and require time.139
Increasing Block Rates
Increasing block rates implement higher per-unit prices as usage volumes rise in accordance to set blocks of usage. The lowest block could be set at an affordable level targeted at low-income households, with higher price blocks achieving cost recovery for the utility while also promoting resource efficiency in water use.140 This would also require reconfiguration of computer systems and business practices.
Minimum Allowance / Lifeline Rate
Minimum allowance structures, sometimes called “lifeline rates,” provide a set minimum amount required for health and safety at a fixed charge (set to an affordable level) without applying volumetric charges at all at the minimum. Any consumption above that amount would be subject to traditional rates adjusted to cover the cost of the lower fixed charge for the minimum allowance. This alternative does not have the administrative burdens of other alternatives since the minimum allowance does not require separate billing routines or rate schedules based on customer class.141
Blue Ribbon Panel Evaluation Results and Interpretation in Updated Environment
The Blue Ribbon Panel assessed alternatives based on evaluation criteria including:142
- Risk of potential legal challenge
- Extent of assistance: number of households
- Extent of assistance: durability
- Resource Efficiency
- Fairness
- Implementability / Understandability
Each alternative was ranked on a scale of one to 10 on each of the criteria. Composite scores and rankings were calculated for each panel member, across different criteria weightings, and for each of the panel member categories (DWSD officials or experts).
The panel found increasing block rates to perform best among all scorers, followed by minimum quality allowance and income-indexed rates, and ended up formally recommending an increasing block rate structure.
It should be noted, however, that in the weighting structure of the various criteria the Blue Ribbon Panel gave heaviest impact to Risk of Potential Legal Challenge (25 percent), followed by Extent of Assistance (both Number of Households and Durability at 20 percent), Fairness (15 percent), Implementability/Understandability (15 percent), and Resource Efficiency (5 percent). Weighting Risk of Legal Challenge highest out of all criteria is understandable from the perspective of administrators wanting to be conservative and avoid unnecessary costs, however given recent developments to the legal landscape this decision seems suspect, especially in light of new empirical evidence on the extent of unaffordability in the region and small impact of WRAP (relative to the size of the problem).
Increasing the weight of the Durability criteria and deflating the weight of the Risk of Legal Challenge criteria seems like an appropriate compromise, since Durability represents the conservative drive of administrators to ensure that any affordability program is sustainable in the long term (by keeping customers able to pay and saving utility costs from collection activity, managing arrearages, and shutoff/turnon activities143 ) and addresses structural drivers of unaffordability. Since the individual panel member scores are noted as being subjective144 and take into account the legal and affordability landscapes as they were understood at the time, this report will not attempt to recalculate the scores according to a different weighting, as the underlying scores pre-weight would likely change with the new information as well.
Compared to the status quo, any of the rate alternatives, income-based, fixed charge, or inclining block rate, would go a long way to address structural unaffordability that is not fundamentally addressed by existing time-limited and underfunded CAPs. Income-based rate structures, in particular, would ensure that benefits are targeted at those who need them, assisting households unable to pay while also minimizing cross-subsidies required to pay for it. At the same time, increasing block rates and lifeline rates may be easier to administer by the utility. No matter which is chosen, an alternative rate structure is necessary. CAPs treat symptoms of unaffordability, but alternative rate designs would treat the root causes.
Appendix 1: Computation of Residential Water and Wastewater Bills
Rate information was collected for all 110 out of 120 communities within GLWA. Rates were obtained from each city, town, township, or charter township via the internet or phone calls with local officials. Ten communities were not responsive to repeated phone calls, including Ash Township, Berlin Township, Commerce Township, Greenwood Township, Keego Harbor, Mayfield Township, Rockwood, Utica, Woodhaven, York Township. Burtchville Township was dropped because local officials indicated that most residents are not connected to the sewer system and many use private wells. These communities are noted with “no data” in tables and blank cells in maps.
Clayton Township and Genesee Township rates were obtained from water rates reported in 2014, then scaled by reported increases for 2015151 and 2016.152 Current rates were unavailable at the time of publication.
Average per capita water consumption in the United States is estimated to be between 2,400 and 3,000 gallons per month.153 Average usage for the GLWA service area was computed using monthly service volume within Detroit (the jurisdiction with the clearest reported monthly service volume) divided by the number of households and the average number of individuals per household.154 The resulting per capita estimate was 2,640 gallons per month, squarely within the national average. Total average household monthly usage given the average family size of 2.6155 is 6,864 gallons. This is roughly confirmed across GLWA, which reports average monthly usage for a family of three as 7,000 gallons.156
That monthly average was combined with individual community water rates per unit, wastewater rates per unit if applicable, fixed charges (water and wastewater), special charges (water and wastewater), and the number of billing periods per year to compute average annual bills broken out by water and wastewater. Because per-unit charges are reported by communities in varying units—gallons, hundred cubic feet (CCF), thousand cubic feet (MCF)—all units were converted to a common unit and prices were scaled accordingly. When billed by meter size, 5/8 connector (or smallest available) was chosen, as most residential meters are this size.
Economic Note: wholesale rates include fixed charges and per unit charges, so differences between community bills are a function of total wholesale volume and municipal markup. It is not possible with current data to disaggregate the proportion each influence has on the final retail cost.
Appendix 2: Choice of Alternative Metric
A number of alternative metrics have been proposed by academics and practitioners. Figure 28 from NAPA’s meta-analysis summarizes a selection of proposals:
Figure 28: Residential Indicator Metric Alternatives

Image source: Czerwinski, et. al., 2017
Most proposals attempt to gain a clearer picture of user affordability by using income quintile instead of MHI. Other proposals not mentioned in the NAPA table suggest using local community MHI rather than the EPA’s nationwide small system MHI or utility-wide MHI, to identify clusters of unaffordability missed by larger-jurisdiction MHI.157 Also notable is that multiple proposals use average ratepayer water bill rather than system costs to more directly compute user affordability before analyzing utility financial capability (acknowledging the interconnection between the two), and most proposals include supplemental contextual information such as trends, poverty rates, housing cost burden, and analysis of sub-populations within a utility service area.
In making recommendations for improvement of the EPA’s metrics, NAPA insists that all metrics should:158
- Be readily available from publicly available data sources
- Be clearly defined and understood
- Be simple, direct, and consistent
- Use valid and reliable measures, according to conventional research standards
- Be applicable for comparative analyses among permittees
To improve the RI metric specifically, NAPA recommends the metric:
- Include all water costs, such as drinking water costs, not just CSO control costs identified in the EPA’s 1997 guidance
- Focus on the income of low-income users most vulnerable to rate increases
- Identify the size of the vulnerable users relative to the utility’s total ratepayer base
- Avoid arbitrary normative thresholds to determine relative burdens
NAPA acknowledges that more nuanced metrics have been proposed, such as a Weighted Average Residential Index159 or an Affordability Ratio of water costs to household disposable income160 using statistical analysis of other consumer expenditures. Whether or not these more complex metrics are more accurate, they violate the stated need for a metric to be direct, readily available from public sources, comparable between jurisdictions, and minimize burden on utility or municipality staff which may be constrained by budgets or technical ability.
Appendix 3: Limitations of Present Study
1. The present study does not empirically address the difference between renters and owners in terms of affordability and distributional impacts. Because many renters do not directly pay water bills, there is a question of how that impacts affordability pressures on household spending and elasticity of demand (how tenants adjust water consumption in response to price signals—e.g. if they do not pay for water they may not closely regulate usage). However, since landlords do pass on at least some costs to tenants, price impacts still hit households in the form of increased rent or decreased landlord spending on other environmental factors (maintenance, lead paint, leaks, mold, pest infestations, etc.). Renters who still face affordability issues are referred to as “hard to reach” populations, since the utility does not have a direct relationship with them.161
2. The present study does not address the EPA’s FCI metric. The RI metrics were more closely criticized by stakeholders, and since FCI is a second-stage indicator, first-stage RI de facto more important. However, analysis of the factors included in the FCI (bond rating, overall net debt as a percentage of full market property value, unemployment rate, MHI, property tax revenues as a percent of full market property value, and property tax collection rate) does give important context for cost allocation, especially in a complex system like GLWA that serves many different communities, likely with varying property tax revenues, tax collection rates, and net debt). This is an avenue for further study.
3. The service GLWA-only wastewater costs are not broken out, since fewer communities are served by GLWA for wastewater than for drinking water. In order to utilize all of the variation available in the data for the present study, sewer costs paid by households for non-GLWA sewer providers, such as the Oakland-Macomb Interceptor are included in the analysis. Since this analysis is focused on consumer affordability this assumption is valid. If this analysis were addressing FCI or another utility-focused affordability measure this assumption would not be valid and the smaller subset of consumers who buy both water and sewer services from GLWA would have to be used.
Appendix 4: Data Tables
Metric Inputs and Results (Community Level)
| Name | Households | Local MHI | Local MHI (20th Percentile) |
Annual Water Costs |
EPA Metric |
Alt Metric |
Alt Metric (20th Percentile) |
EPA to Alt Difference |
EPA to Alt Difference (20th Percentile) |
|---|---|---|---|---|---|---|---|---|---|
| Bloomfield Hills | 1296 | $169,265 | $62,100 | $1,000.88 | 2 | 0.59 | 1.61 | 1.41 | 0.39 |
| Grosse Pointe Shores |
1125
|
$152,092 | $64,056 | $1,375.27 | 2.7 | 0.9 | 2.15 | 1.8 | 0.55 |
| Huntington Woods |
2424
|
$121,528 | $75,695 | $1,444.37 | 2.83 | 1.19 | 1.91 | 1.64 | 0.92 |
| Bloomfield Township |
16707
|
$118,317 | $46,120 | $1,287.12 | 2.48 | 1.09 | 2.79 | 1.39 | -0.31 |
| Birmingham |
8935
|
$112,545 | $48,932 | $1,172.42 | 2.23 | 1.04 | 2.4 | 1.19 | -0.17 |
| Pleasant Ridge |
1111
|
$107,656 | $50,318 | $1,260.84 | 2.51 | 1.17 | 2.51 | 1.34 | 0 |
| Northville Township | 11050 | $106,288 | $41,321 | $1,294.16 | 2.58 | 1.22 | 3.13 | 1.36 | -0.55 |
| Grosse Pointe Park |
4191
|
$101,484 | $39,739 | $668.40 | 1.35 | 0.66 | 1.68 | 0.69 | -0.33 |
| York Township |
2432
|
$99,224 | $56,758 | No Data | - | - | - | - | - |
| Grosse Ile Township |
4164
|
$94,659 | $41,139 | $1,442.63 | 3.02 | 1.52 | 3.51 | 1.5 | -0.49 |
| West Bloomfield Township |
24558
|
$93,729 | $41,699 | $969.85 | 1.94 | 1.03 | 2.33 | 0.91 | -0.39 |
| Grosse Pointe Woods |
6079
|
$93,404 | $42,309 | $1,084.08 | 2.16 | 1.16 | 2.56 | 1 | -0.4 |
| Northville |
1146
|
$90,938 | $57,739 | $1,277.12 | 2.58 | 1.4 | 2.21 | 1.18 | 0.37 |
| Lathrup Village |
1553
|
$90,875 | $46,421 | $1,345.19 | 2.5 | 1.48 | 2.9 | 1.02 | -0.4 |
| Macomb Township |
28610
|
$89,954 | $47,454 | $882.53 | 1.73 | 0.98 | 1.86 | 0.75 | -0.13 |
| Troy |
31247
|
$88,954 | $38,112 | $725.62 | 1.47 | 0.82 | 1.9 | 0.65 | -0.43 |
| Commerce Township |
15618
|
$86,856 | $40,433 | No Data | - | - | - | - | - |
| Orion Township |
13294
|
$86,299 | $38,634 | $1,143.49 | 2.09 | 1.33 | 2.96 | 0.76 | -0.87 |
| Novi |
22862
|
$86,193 | $37,497 | $871.16 | 1.71 | 1.01 | 2.32 | 0.7 | -0.61 |
| Canton Township | 31785 | $84,876 | $39,813 | $1,262.70 | 2.45 | 1.49 | 3.17 | 0.96 | -0.72 |
| Rochester Hills |
28171
|
$83,507 | $37,429 | $1,002.76 | 1.97 | 1.2 | 2.68 | 0.77 | -0.71 |
| Washington Township |
9923
|
$82,348 | $34,921 | $1,235.74 | 2.41 | 1.5 | 3.54 | 0.91 | -1.13 |
| Bruce Township |
3140
|
$81,099 | $36,413 | $880.99 | 1.81 | 1.09 | 2.42 | 0.72 | -0.61 |
| Plymouth |
4113
|
$78,254 | $32,764 | $1,132.90 | 2.18 | 1.45 | 3.46 | 0.73 | -1.28 |
| Plymouth Township |
10840
|
$78,060 | $36,058 | $840.15 | 1.6 | 1.08 | 2.33 | 0.52 | -0.73 |
| Berkley |
6528
|
$74,172 | $36,724 | $1,194.46 | 2.34 | 1.61 | 3.25 | 0.73 | -0.91 |
| Huron Township |
5468
|
$72,206 | $35,312 | $1,228.93 | 2.37 | 1.7 | 3.48 | 0.67 | -1.11 |
| Farmington Hills |
34726
|
$71,463 | $30,575 | $1,307.89 | 2.58 | 1.83 | 4.28 | 0.75 | -1.7 |
| Superior Township |
4970
|
$71,413 | $28,590 | $538.32 | 1.07 | 0.75 | 1.88 | 0.32 | -0.81 |
| Livonia |
37164
|
$71,063 | $33,864 | $825.15 | 1.64 | 1.16 | 2.44 | 0.48 | -0.8 |
| Pittsfield Township |
13942
|
$70,463 | $30,820 | $954.63 | 1.89 | 1.35 | 3.1 | 0.54 | -1.21 |
| Brownstown Township |
11077
|
$70,252 | $28,795 | $875.21 | 1.75 | 1.25 | 3.04 | 0.5 | -1.29 |
| Berlin Township |
3411
|
$69,855 | $32,451 | No Data | - | - | - | - | - |
| Chesterfield Township |
16900
|
$69,248 | $30,719 | $907.32 | 1.73 | 1.31 | 2.95 | 0.42 | -1.22 |
| Augusta Township |
2293
|
$68,542 | $40,434 | $1,537.34 | 3.01 | 2.24 | 3.8 | 0.77 | -0.79 |
| Royal Oak |
28526
|
$68,504 | $30,520 | $1,400.01 | 2.57 | 2.04 | 4.59 | 0.53 | -2.02 |
| Greenwood Township |
538
|
$67,794 | $30,929 | No Data | - | - | - | - | - |
| Shelby Township |
30034
|
$66,929 | $31,813 | $1,142.20 | 2.19 | 1.71 | 3.59 | 0.48 | -1.4 |
| Allen Park |
10805
|
$65,848 | $31,536 | $888.82 | 1.74 | 1.35 | 2.82 | 0.39 | -1.08 |
| Sylvan Lake |
799
|
$65,781 | $32,837 | $1,159.81 | 2.22 | 1.76 | 3.53 | 0.46 | -1.31 |
| Gaines Township |
2561
|
$65,742 | $30,518 | $678.61 | 1.33 | 1.03 | 2.22 | 0.3 | -0.89 |
| Farmington |
4659
|
$64,388 | $29,935 | $1,269.25 | 2.45 | 1.97 | 4.24 | 0.48 | -1.79 |
| Gibraltar |
1791
|
$64,016 | $27,458 | $1,658.89 | 3.15 | 2.59 | 6.04 | 0.56 | -2.89 |
| Grand Blanc Township |
14461
|
$63,501 | $29,243 | $1,313.08 | 2.75 | 2.07 | 4.49 | 0.68 | -1.74 |
| Flushing Township |
3766
|
$62,019 | $31,338 | $1,360.96 | 2.8 | 2.19 | 4.34 | 0.61 | -1.54 |
| Lenox Township |
3097
|
$61,382 | $33,727 | $1,762.86 | 3.27 | 2.87 | 5.23 | 0.4 | -1.96 |
| Clayton Township |
2871
|
$60,762 | $32,175 | $1,077.17 | 2.11 | 1.77 | 3.35 | 0.34 | -1.24 |
| Sterling Heights |
49754
|
$60,492 | $26,625 | $1,014.16 | 1.92 | 1.68 | 3.81 | 0.24 | -1.89 |
| Clawson |
5564
|
$59,259 | $28,345 | $1,465.39 | 2.73 | 2.47 | 5.17 | 0.26 | -2.44 |
| Woodhaven |
5124
|
$58,500 | $26,801 | No Data | - | - | - | - | - |
| Mundy Township |
5935
|
$57,939 | $31,589 | $930.63 | 1.9 | 1.61 | 2.95 | 0.29 | -1.05 |
| Harrison Township |
11090
|
$57,673 | $24,035 | $983.57 | 1.82 | 1.71 | 4.09 | 0.11 | -2.27 |
| Flat Rock |
3602
|
$57,500 | $26,687 | $658.94 | 1.29 | 1.15 | 2.47 | 0.14 | -1.18 |
| Trenton |
7859
|
$56,888 | $25,727 | $492.80 | 0.97 | 0.87 | 1.92 | 0.1 | -0.95 |
| Ash Township |
3006
|
$56,055 | $24,645 | No Data | - | - | - | - | - |
| Rockwood |
1326
|
$55,636 | $31,034 | No Data | - | - | - | - | - |
| Sumpter Township |
3516
|
$55,237 | $23,938 | $1,168.90 | 2.15 | 2.12 | 4.88 | 0.03 | -2.73 |
| Ferndale |
9755
|
$55,159 | $25,830 | $1,230.97 | 2.41 | 2.23 | 4.77 | 0.18 | -2.36 |
| St. Clair Shores |
26717
|
$54,590 | $25,899 | $1,331.59 | 2.55 | 2.44 | 5.14 | 0.11 | -2.59 |
| Van Buren Township |
11172
|
$53,872 | $28,197 | $909.36 | 1.79 | 1.69 | 3.23 | 0.1 | -1.44 |
| Vienna Township |
5039
|
$53,705 | $27,620 | $1,077.87 | 2.25 | 2.01 | 3.9 | 0.24 | -1.65 |
| Auburn Hills |
8934
|
$53,686 | $24,998 | $1,127.09 | 2.24 | 2.1 | 4.51 | 0.14 | -2.27 |
| Riverview |
5005
|
$53,502 | $21,540 | $1,165.75 | 2.31 | 2.18 | 5.41 | 0.13 | -3.1 |
| Burtchville Township |
1628
|
$53,073 | $18,900 | No Data | - | - | - | - | - |
| Fraser |
6254
|
$52,865 | $23,263 | $1,415.09 | 2.61 | 2.68 | 6.08 | -0.07 | -3.47 |
| Garden City |
10292
|
$52,788 | $24,111 | $1,056.90 | 1.99 | 2 | 4.38 | -0.01 | -2.39 |
| Utica |
2255
|
$51,325 | $20,250 | No Data | - | - | - | - | - |
| Southgate |
12563
|
$51,138 | $23,079 | $605.32 | 1.17 | 1.18 | 2.62 | -0.01 | -1.45 |
| Mayfield Township |
3058
|
$50,948 | $27,045 | No Data | - | - | - | - | - |
| Flushing |
3410
|
$50,625 | $24,324 | $1,358.40 | 2.69 | 2.68 | 5.58 | 0.01 | -2.89 |
| Southfield |
32572
|
$50,371 | $20,941 | $1,171.81 | 2.24 | 2.33 | 5.6 | -0.09 | -3.36 |
| Redford Township |
17957
|
$50,129 | $23,734 | $1,121.18 | 2.17 | 2.24 | 4.72 | -0.07 | -2.55 |
| Davison Township |
8373
|
$50,127 | $24,487 | $1,009.10 | 2.13 | 2.01 | 4.12 | 0.12 | -1.99 |
| Oak Park |
11657
|
$49,811 | $19,408 | $1,338.08 | 2.49 | 2.69 | 6.89 | -0.2 | -4.4 |
| Clinton Township |
43415
|
$49,637 | $21,892 | $1,046.23 | 2.04 | 2.11 | 4.78 | -0.07 | -2.74 |
| Harper Woods |
5177
|
$49,306 | $22,691 | $747.23 | 1.45 | 1.52 | 3.29 | -0.07 | -1.84 |
| Montrose Township |
2120
|
$48,966 | $26,232 | $1,288.17 | 2.64 | 2.63 | 4.91 | 0.01 | -2.27 |
| Dearborn |
31279
|
$48,421 | $17,906 | $929.04 | 1.77 | 1.92 | 5.19 | -0.15 | -3.42 |
| Wixom |
6103
|
$47,856 | $20,635 | $897.81 | 1.81 | 1.88 | 4.35 | -0.07 | -2.54 |
| Ypsilanti Township |
22516
|
$46,339 | $20,673 | $861.31 | 1.71 | 1.86 | 4.17 | -0.15 | -2.46 |
| Dearborn Heights |
20547
|
$45,929 | $19,165 | $1,264.66 | 2.44 | 2.75 | 6.6 | -0.31 | -4.16 |
| Belleville |
1605
|
$45,737 | $20,452 | $1,214.62 | 2.37 | 2.66 | 5.94 | -0.29 | -3.57 |
| Westland |
34188
|
$44,808 | $20,793 | $1,169.56 | 2.26 | 2.61 | 5.62 | -0.35 | -3.36 |
| Romulus |
8690
|
$44,727 | $17,587 | $873.93 | 1.71 | 1.95 | 4.97 | -0.24 | -3.26 |
| Swartz Creek |
2397
|
$44,525 | $23,615 | $1,428.99 | 2.97 | 3.21 | 6.05 | -0.24 | -3.08 |
| Eastpointe |
12323
|
$44,240 | $17,765 | $1,641.03 | 3.08 | 3.71 | 9.24 | -0.63 | -6.16 |
| Warren |
53225
|
$44,017 | $20,111 | $703.91 | 1.41 | 1.6 | 3.5 | -0.19 | -2.09 |
| Burton |
11581
|
$43,586 | $17,533 | $1,655.78 | 3.38 | 3.8 | 9.44 | -0.42 | -6.06 |
| Keego Harbor |
1414
|
$43,281 | $20,377 | No Data | - | - | - | - | - |
| Madison Heights |
13164
|
$43,158 | $18,432 | $670.18 | 1.3 | 1.55 | 3.64 | -0.25 | -2.34 |
| Genesee Township |
8240
|
$43,150 | $21,273 | $787.19 | 1.54 | 1.82 | 3.7 | -0.28 | -2.16 |
| Roseville |
19690
|
$42,036 | $20,316 | $1,055.52 | 1.97 | 2.51 | 5.2 | -0.54 | -3.23 |
| Taylor |
23825
|
$41,897 | $17,824 | $681.22 | 1.37 | 1.63 | 3.82 | -0.26 | -2.45 |
| Lincoln Park |
14265
|
$41,406 | $17,168 | $799.53 | 1.55 | 1.93 | 4.66 | -0.38 | -3.11 |
| Flint Township |
12837
|
$41,337 | $19,481 | $1,263.87 | 2.48 | 3.06 | 6.49 | -0.58 | -4.01 |
| Wayne |
6788
|
$40,973 | $31,536 | $1,338.14 | 2.64 | 3.27 | 4.24 | -0.63 | -1.6 |
| Melvindale |
3899
|
$36,870 | $14,257 | $1,418.35 | 2.69 | 3.85 | 9.95 | -1.16 | -7.26 |
| Montrose |
642
|
$36,176 | $15,765 | $1,520.50 | 3.09 | 4.2 | 9.64 | -1.11 | -6.55 |
| Center Line |
3650
|
$35,955 | $14,504 | $918.39 | 1.73 | 2.55 | 6.33 | -0.82 | -4.6 |
| Mount Morris Township |
8263
|
$33,819 | $14,842 | $1,299.37 | 2.69 | 3.84 | 8.75 | -1.15 | -6.06 |
| Hazel Park | 7115 | $33,379 | $14,947 | $1,147.02 | 2.23 | 3.44 | 7.67 | -1.21 | -5.44 |
| Ypsilanti |
7987
|
$33,055 | $12,484 | $821.38 | 1.62 | 2.48 | 6.58 | -0.86 | -4.96 |
| Lapeer | 3561 | $31,805 | $31,786 | $1,231.63 | 2.34 | 3.87 | 3.87 | -1.53 | -1.53 |
| Imlay City |
1333
|
$31,287 | $18,929 | $1,418.40 | 2.87 | 4.53 | 7.49 | -1.66 | -4.62 |
| Inkster |
9477
|
$31,285 | $10,351 | $1,230.58 | 2.29 | 3.93 | 11.89 | -1.64 | -9.6 |
| Pontiac | 23225 | $30,152 | $11,706 | $1,412.52 | 2.81 | 4.68 | 12.07 | -1.87 | -9.26 |
| Royal Oak Township | 1063 | $27,837 | $11,500 | $1,258.80 | 2.36 | 4.52 | 10.95 | -2.16 | -8.59 |
| River Rouge |
2825
|
$27,463 | $9,435 | $1,098.79 | 2.09 | 4 | 11.65 | -1.91 | -9.56 |
| Ecorse |
3527
|
$26,496 | $11,525 | $738.53 | 1.44 | 2.79 | 6.41 | -1.35 | -4.97 |
| Detroit |
256985
|
$26,249 | $9,574 | $1,246.51 | 2.35 | 4.75 | 13.02 | -2.4 | 10.67 |
| Flint |
40046
|
$25,650 | $9,897 | $1,213.53 | 2.45 | 4.73 | 12.26 | -2.28 | -9.81 |
| Hamtramck |
6296
|
$23,609 | $9,818 | $1,333.36 | 2.5 | 5.65 | 13.58 | -3.15 | -11.08 |
| Mount Morris | 1183 | $21,196 | $10,574 | $1,702.71 | 3.52 | 8.03 | 16.1 | -4.51 | -12.58 |
Water and Wastewater Costs (Community Level)
| Customer | Annual Water | Annual Wastewater | Annual Total |
|---|---|---|---|
| Allen Park | $437.81 | $451.02 | $888.82 |
| Almont | $673.21 | $949.97 | $1,623.18 |
| Ash Township | - | - | - |
| Auburn Hills | $607.59 | $519.50 | $1,127.09 |
| Augusta Township | $758.76 | $778.58 | $1,537.34 |
| Belleville | $587.96 | $626.67 | $1,214.62 |
| Berkley | $585.67 | $608.79 | $1,194.46 |
| Berlin Township | - | - | - |
| Beverly Hills | $394.60 | $792.10 | $1,186.70 |
| Bingham Farms | $291.62 | $285.78 | $577.40 |
| Birmingham | $472.54 | $699.88 | $1,172.42 |
| Bloomfield Hills | $553.80 | $447.08 | $1,000.88 |
| Bloomfield Township | $572.31 | $714.81 | $1,287.12 |
| Brownstown Township | $490.32 | $384.89 | $875.21 |
| Bruce Township | $568.99 | $312.00 | $880.99 |
| Burtchville Township | - | - | - |
| Burton | $1,045.62 | $610.16 | $1,655.78 |
| Canton Township | $593.87 | $668.83 | $1,262.70 |
| Center Line | $347.59 | $570.80 | $918.39 |
| Chesterfield Township | $368.00 | $539.32 | $907.32 |
| Clawson | $496.29 | $969.10 | $1,465.39 |
| Clayton Township | $538.58 | $538.58 | $1,077.17 |
| Clinton Township | $497.58 | $548.65 | $1,046.23 |
| Commerce Township | - | - | - |
| Davison Township | $742.94 | $266.16 | $1,009.10 |
| Dearborn | $385.24 | $543.80 | $929.04 |
| Dearborn Heights | $565.44 | $699.22 | $1,264.66 |
| Eastpointe | $603.60 | $1,037.43 | $1,641.03 |
| Ecorse | $347.44 | $391.09 | $738.53 |
| Farmington | $572.85 | $696.40 | $1,269.25 |
| Farmington Hills | $679.16 | $628.73 | $1,307.89 |
| Ferndale | $615.49 | $615.49 | $1,230.97 |
| Flat Rock | $329.47 | $329.47 | $658.94 |
| Flint | $710.27 | $503.26 | $1,213.53 |
| Flint Township | $631.94 | $631.94 | $1,263.87 |
| Flushing | $722.44 | $635.96 | $1,358.40 |
| Flushing Township | $890.24 | $470.72 | $1,360.96 |
| Fraser | $439.85 | $975.2 | $1,415.09 |
| Gaines Township | $329.83 | $348.78 | $678.61 |
| Garden City | $399.68 | $657.23 | $1,056.90 |
| Genesee Township | $393.59 | $393.59 | $787.19 |
| Gibraltar | $662.24 | $996.65 | $1,658.89 |
| Grand Blanc Township | $936.22 | $376.86 | $1,313.08 |
| Greenwood Township | - | - | - |
| Grosse Ile Township | $1,018.66 | $423.96 | $1,442.63 |
| Grosse Pointe Park | $400.80 | $267.60 | $668.40 |
| Grosse Pointe Shores | $687.64 | $687.64 | $1,375.27 |
| Grosse Pointe Woods | $595.44 | $488.64 | $1,084.08 |
| Hamtramck | $487.20 | $846.16 | $1,333.36 |
| Harper Woods | $353.96 | $393.27 | $747.23 |
| Harrison Township | $322.77 | $660.81 | $983.57 |
| Hazel Park | $542.51 | $604.50 | $1,147.02 |
| Huntington Woods | $722.19 | $722.19 | $1,444.37 |
| Huron Township | $548.16 | $680.77 | $1,228.93 |
| Imlay City | $854.40 | $564.00 | $1,418.40 |
| Inkster | $418.43 | $812.15 | $1,230.58 |
| Keego Harbor | - | - | - |
| Lapeer | $495.97 | $735.66 | $1,231.63 |
| Lathrup Village | $441.37 | $903.83 | $1,345.19 |
| Lenox Township | $585.79 | $1,177.08 | $1,762.86 |
| Lincoln Park | $370.03 | $429.49 | $799.53 |
| Livonia | $439.00 | $386.15 | $825.15 |
| Macomb Township | $441.54 | $440.99 | $882.53 |
| Madison Heights | $318.62 | $351.57 | $670.18 |
| Mayfield Township | - | - | - |
| Melvindale | $559.37 | $858.98 | $1,418.35 |
| Montrose | $925.40 | $595.10 | $1,520.50 |
| Montrose Township | $832.92 | $455.24 | $1,288.17 |
| Mount Morris | $1,144.80 | $557.91 | $1,702.71 |
| Mount Morris Township | $883.67 | $415.70 | $1,299.37 |
| Mundy Township | $582.03 | $348.60 | $930.63 |
| New Haven | $708.88 | $652.87 | $1,361.75 |
| Northville | $763.35 | $513.77 | $1,277.12 |
| Northville Township | $720.39 | $573.77 | $1,294.16 |
| Novi | $435.58 | $435.58 | $871.16 |
| Oak Park | $451.02 | $887.06 | $1,338.08 |
| Orion Township | $319.32 | $824.17 | $1,143.49 |
| Pittsfield Township | $505.39 | $449.24 | $954.63 |
| Pleasant Ridge | $683.82 | $577.02 | $1,260.84 |
| Plymouth | $502.62 | $630.29 | $1,132.90 |
| Plymouth Township | $336.06 | $504.09 | $840.15 |
| Pontiac | $769.02 | $643.50 | $1,412.52 |
| Redford Township | $509.39 | $611.79 | $1,121.18 |
| River Rouge | $446.43 | $652.35 | $1,098.79 |
| Riverview | $624.06 | $541.69 | $1,165.75 |
| Rochester Hills | $505.50 | $497.26 | $1,002.76 |
| Rockwood | - | - | - |
| Romeo | $490.09 | $724.84 | $1,214.93 |
| Romulus | $428.16 | $445.77 | $873.93 |
| Roseville | $360.39 | $695.12 | $1,055.52 |
| Royal Oak | $412.18 | $987.83 | $1,400.01 |
| Royal Oak Township | $455.04 | $803.76 | $1,258.80 |
| Shelby Township | $488.13 | $654.07 | $1,142.20 |
| South Rockwood | $592.35 | $680.48 | $1,272.83 |
| Southfield | $486.25 | $685.55 | $1,171.81 |
| Southgate | $272.16 | $333.16 | $605.32 |
| St. Clair Shores | $572.92 | $758.67 | $1,331.59 |
| Sterling Heights | $390.20 | $623.96 | $1,014.16 |
| Sumpter Township | $346.40 | $822.50 | $1,168.90 |
| Superior Township | $297.12 | $241.20 | $538.32 |
| Swartz Creek | $985.92 | $443.08 | $1,428.99 |
| Sylvan Lake | $487.24 | $672.57 | $1,159.81 |
| Taylor | $390.16 | $291.06 | $681.22 |
| Trenton | $246.40 | $246.40 | $492.80 |
| Troy | $432.73 | $292.89 | $725.62 |
| Utica | - | - | - |
| Van Buren Township | $457.56 | $451.80 | $909.36 |
| Vienna Township | $763.56 | $314.31 | $1,077.87 |
| Walled Lake | $652.29 | $485.08 | $1,137.37 |
| Warren | $401.50 | $302.40 | $703.91 |
| Washington Township | $601.90 | $633.83 | $1,235.74 |
| Wayne | $692.54 | $645.60 | $1,338.14 |
| West Bloomfield Township | $550.44 | $419.41 | $969.85 |
| Westland | $532.07 | $637.50 | $1,169.56 |
| Wixom | $523.23 | $374.58 | $897.81 |
| Woodhaven | - | - | - |
| York Township | - | - | - |
| Ypsilanti | $426.17 | $395.21 | $821.38 |
| Ypsilanti Township | $458.62 | $402.70 | $861.31 |
| Detroit | $463.76 | $782.75 | $1,246.51 |
- 1Regarding the results of the study’s regional price and price escalation levels, the report notes: “Some regional trends are observed; however, it is important to note that regional sampling is variable and limited. For example, the Northeast region is represented by only two utilities. Based on the utilities observed, it would appear that the Midwest and Northeast have some of the lowest average water rates (see Figure 8) 5; however, Figure 7 would suggest that these same regions have had some of the highest annual price escalation rates in recent years. Conversely, although the West-Pacific states have the highest average regional water rates (see Figure 8), the annual price escalation rate, at 5.3% (see Figure 7), is only slightly higher than the entire sample average of 4.1%. There are a wide range and variability in both water volume rates and historical price escalation rates across the southern utilities observed in this study, with an average escalation of about 3.5% across the entire southern region. The study’s scope did not include an investigation into why such a large variation exists, but these variations are often driven by local infrastructure investments by the given utility (Walton 2017).” They cite the following report that provides information on the influence of price by local infrastructure investments. Brett Walton, “Price of Water 2017: Four Percent Increase in 30 Large US Cities,” Circle of Blue, May 18, 2017, https://www.circleofblue.org/2017/water-management/pricing/price-water-2017-four-percent-increase-30-large-u-s-cities/
- 2Shadi Eskaf, “Four Trends in Government Spending on Water and Wastewater Utilities Since 1956,” The Environmental Finance Blog, UNC School of Government Environmental Finance Center, September 9, 2015, http://efc.web.unc.edu/2015/09/09/four-trends-government-spending-water/.
- 3Richard F. Anderson, “Local Governmental Investment in Water and Sewer, 2000-2015,” Resources, United States Conference of Mayors, January 10, 2018, https://www.usmayors.org/2018/01/10/local-government-investment-in-water-and-sewer-2000-2015/ In the US Conference of Mayors’ review of local and government investment in water and sewer 2000-2015, they stated: “Congressional framers of the Clean Water and the Safe Drinking Water Acts promised local governments a technical and financial partnership to achieve national water goals. Those promises are long forgotten. Congress and the Executive branch have steadily retreated from responsibility for local water and sewer services, although they continue to stack up expensive regulatory mandates that trigger affordability burdens for low- and middle-income households. …” The environmental standards set to meet the 1970 Clean Water Act amendments resulted in the need for local systems to upgrade and repair current systems to meet increased standards for public health and environmental quality. Raising these standards created a need for large capital investments that were inadequately matched by federal funding and federal funding for these infrastructure upgrades and repairs.
- 4Page v5, v15-17 map and identify details on the parts of the system that stay with DWSD-R and those staying under the responsibility of GLWA. For example, all transmission lines between 24 to 120 inches are the responsibility of GLWA. See the Draft GLWA Capital Improvement Plan 2018-2022 https://outreach.glwater.org/LinkClick.aspx?fileticket=ZGgKOqkj-es%3D&tabid=39
- 5UN General Assembly, Resolution 70/169, The Human Rights to Safe Drinking Water and Sanitation, A/RES/70169 (Feb. 22, 2016), http://www.un.org/en/ga/search/view_doc.asp?symbol=A/RES/70/169.
- 6United States Environmental Protection Agency, Drinking Water Requirements for States and Public Water Systems: Variances and Exemptions, accessed March 16, 2019, https://www.epa.gov/dwreginfo/variances-and-exemptions.; see also: United States Environmental Protection Agency, Variances and Exemptions: A Quick Reference Guide, accessed March 16, 2019, https://nepis.epa.gov/Exe/ZyPDF.cgi?Dockey=901U0I00.txt.
- 7United States Environmental Protection Agency, Drinking Water State Revolving Fund, accessed March 16, 2019. https://www.epa.gov/drinkingwatersrf.; United States Environmental Protection Agency, Clean Water State Revolving Fund, accessed March 16, 2019, https://www.epa.gov/cwsrf.
- 8“United States Environmental Protection Agency, How the Drinking Water State Revolving Fund Works, accessed March 16, 2019, https://www.epa.gov/drinkingwatersrf/how-drinking-water-state-revolving-fund-works#tab-1
- 9United States Environmental Protection Agency, Drinking Water Requirements for States and Public Water Systems: Variances and Exemptions, accessed March 16, 2019, https://www.epa.gov/dwreginfo/variances-and-exemptions.; see also: United States Environmental Protection Agency, Variances and Exemptions: A Quick Reference Guide, accessed March 16, 2019, https://nepis.epa.gov/Exe/ZyPDF.cgi?Dockey=901U0I00.txt.
- 10Bolt v. City of Lansing, 587 N.W.2d 264 (1998). The Headlee Amendment states in relevant part: “Units of Local Government are hereby prohibited from levying any tax not authorized by law or charter when this section is ratified or from increasing the rate of an existing tax above that rate authorized by law or charter when this section is ratified, without the approval of a majority of the qualified electors of that unit of Local Government voting thereon. Mich. Const. art. IX, § 31.
- 11The debate surrounding water affordability measures constituting illegal taxes stems, in part, from statutory interpretation of 40 C.F.R. Section 35.2140(i)(1)-(3), which provides that, “(1) Grantees may establish lower user charge rates for low income residential users after providing for public notice and hearing… (2) Any lower user charge rate for low income residential users must be defined as a uniform percentage of the user charge rate charged after other residential users. (3) The costs of any user charge reductions afforded a low income residential class must be proportionately absorbed by all other user classes. The total revenue for operation and maintenance (including equipment replacement) of the facilities must not be reduced as a result of establishing a low income residential user class.” Both the reference to a “uniform percentage,” as well as the stipulation for cost offset absorption lend readers to the view that such prescription for affordability measures carries the effectual burden of a tax.
- 12It is unlikely that this will be interpreted as a tax because, “The Headlee Amendment requires voter approval only for a “tax” not already authorized by law at the time of its passage. It does not require voter approval to impose or raise a regulatory or user fee. Bolt, 459 Mich. at 158-59. Nor does the amendment require voter approval for levying or raising a tax that was already approved by law at the time the Headlee Amendment was passed.” Sean Flynn, Constitutionality of Water Affordability Program for Detroit (Wash. D.C.: Spiegel & McDiarmid, Sept. 26, 2005).
- 13Walton, Price of Water.
- 14Ibid.
- 15City of Detroit, Blue Ribbon Panel on Affordability, “Final Report” (Report presented at the Detroit City Council Public Health & Safety Committee meeting, Detroit, MI, February 8, 2016), p. 28, https://detroitmi.gov/document/blue-ribbon-panel-affordability-brpa-report; WRAP Advisory Group, Water Residential Assistance Program: Program Design Report (GLWA, 2015), p. 6, https://www.detroitmindsdying.com/wp-content/uploads/2015/08/5-GLWA-afford.pdf
- 16United States Water Alliance, An Equitable Water Future: A National Briefing Paper, 2017, http://uswateralliance.org/sites/uswateralliance.org/files/publications/uswa_waterequity_FINAL.pdf
- 17UN General Assembly, Resolution 70/169, The Human Rights to Safe Drinking Water and Sanitation, A/RES/70169 (Feb. 22, 2016), http://www.un.org/en/ga/search/view_doc.asp?symbol=A/RES/70/169; Leo Heller, “Sanitation is a Human Right,” United Nations Human Rights, accessed March 23, 2019, https://www.ohchr.org/en/NewsEvents/Pages/DisplayNews.aspx?NewsID=22400&LangID=E
- 18Ruth Lister, “Water Poverty,” Perspectives in Public Health (April 1995), https://journals-ohiolink-edu.proxy.lib.ohio-state.edu/pg_99?117374770149779::NO::P99_ENTITY_ID,P99_ENTITY_TYPE:29887393,MAIN_FILE&cs=3n7_79qVKjQWmz3AbpHOfqdU4PwkB65TP8TXGKw_cppYh2k-QlbEwYoOB1onrau9-sk7qGOMK563S3AYuw9gTFQ
- 19Id.
- 20Joel Kurth, “Detroit Cites Progress, but Water Shutoffs Actually Rose Last Year,” Bridge, May 2, 2017 https://www.bridgemi.com/detroit-journalism-cooperative/detroit-cites-progress-water-shutoffs-actually-rose-last-year
- 21Katrease Stafford, “Controversial Water Shutoffs Could Hit 17,461 Detroit Households,” Detroit Free Press, March 26, 2018, https://www.freep.com/story/news/local/michigan/detroit/2018/03/26/more-than-17-000-detroit-households-risk-water-shutoffs/452801002/
- 22Stafford, Controversial Water Shutoffs, quoting DWSD Director Gary Brown, “We’re trying to be compassionate about it but at the same time I'm bound by law to collect the services that are rendered. It’s unfair to the 90% of residential customers that are paying. That’s the tricky part: separating the truly needy from those who are just not paying."
- 23Ruth Lister, “Water Poverty,” Perspectives in Public Health (April 1995), https://journals-ohiolink-edu.proxy.lib.ohio-state.edu/pg_99?117374770149779::NO::P99_ENTITY_ID,P99_ENTITY_TYPE:29887393,MAIN_FILE&cs=3n7_79qVKjQWmz3AbpHOfqdU4PwkB65TP8TXGKw_cppYh2k-QlbEwYoOB1onrau9-sk7qGOMK563S3AYuw9gTFQ
- 24Guy Hutton, Considerations in Evaluating the Cost Effectiveness of Environmental Health Interventions, (Geneva: World Health Organization, 2000), p. 24, http://www.who.int/water_sanitation_health/economic/costeffecthutton.pdf; Guy Hutton, Economic Evaluation and Priority Setting in Water and Sanitation Interventions, (London, UK: World Health Organization, 2001), http://www.who.int/water_sanitation_health/dwq/iwachap15.pdf.
- 25Sheila M. Olmstead, W. Michael Hanemann, and Robert N. Stavins, “Water Demand Under Alternative Price Structures,” Journal of Environmental Economics and Management 54, no. 2 (September 2007): 181-198; Jasper M. Dalhusien, Raymond J. G. M. Florax, Henri L. F. de Groot, and Peter Nijkamp, “Price and Income Elasticities of Residential Water Demand: A Meta-Analysis,” Land Economics 79, no. 2 (May 2003): 292-308.
- 26Elizabeth A. Mack and Sarah Wrase, “A Burgeoning Crisis? A Nationwide Assessment of the Geography of Water Affordability in the United States,” PLOS ONE 12, no. 1 (January 2017), https://doi.org/10.1371/journal.pone.0169488.
- 27Blue Ribbon Panel, Final Report
- 28Lara Moehlman, “Over 17,000 Households Could Face Water Shutoffs in Detroit,” Michigan Radio, NPR, March 26, 2018, http://michiganradio.org/post/over-17000-households-could-face-water-shutoffs-detroit
- 29Blue Ribbon Panel, Final Report, 102.
- 30“Flint Water Crisis Fast Facts,” CNN, last modified December 6, 2018, https://www.cnn.com/2016/03/04/us/flint-water-crisis-fast-facts/index.html.
- 31 Anne Runkle, “Waterford Residents May File for Water, Sewer Refunds Under Law,” Oakland Press News, June 16, 2017, http://www.theoaklandpress.com/general-news/20170616/waterford-residents-may-file-for-water-sewer-refunds-under-lawsuit
- 32United States Government Accountability Office, Water Infrastructure: Information on Selected Midsize and Large Cities with Declining Populations, (GAO-16-785: September 2016), https://www.gao.gov/assets/680/679783.pdf.
- 33Great Lakes Water Authority, “Great Lakes Water Authority Capital Improvement Plan 2018-2022” (working paper, 2017), https://outreach.glwater.org/LinkClick.aspx?fileticket=ZGgKOqkj-es%3D&tabid=39; Detroit Water and Sewerage Department, “2018-2022 CIP Report” (working paper version 1, City of Detroit, Detroit, MI, January 31, 2017). GLWA plans to spend $1,124,147,000 for water and $1,115,217,000 for wastewater. DWSD plans to spend $290,000,000 for water and $240,000,000 for wastewater.
- 34American Water Works Association, M1 Manual: Principles of Water Rates, Fees and Charges, 7th Edition, (2017), https://www.awwa.org/Portals/0/files/publications/documents/M1Ed7LookInside.pdf
- 35Janice Beecher, Patrick Mann, and James Landers, Cost Allocation and Rate Design for Water Utilities, (Columbus, OH: National Regulatory Research Institute, December 1990), http://ipu.msu.edu/wp-content/uploads/2016/12/Beecher-Mann-Cost-Allocation-Rate-Design-90-17-Dec-90-1.pdf
- 36AWWA, M1 Manual, 4.
- 37AWWA, 6.
- 38Stanley J. Czerwinski, Elizabeth Fretwell, R. Scott Fosler, Greg Lindsey, and Michael A. Pagano, Developing a New Framework for Community Affordability of Clean Water Services (Washington D.C.: National Academy of Public Administration, October 2017), p. 31, https://www.napawash.org/uploads/Academy_Studies/NAPA_EPA_FINAL_REPORT_110117.pdf
- 39Czerwinski et al., Developing a New Framework.
- 40US Environmental Protection Agency, Combined Sewer Overflows—Guidance for Financial Capability Assessment and Schedule Development (EPA 832-B-97-004, February 1997).
- 41“Small Drinking Water System Variances,” United States Environmental Protection Agency, accessed March 16, 2019, https://www.epa.gov/dwregdev/small-drinking-water-system-variances. It should be noted that although EPA defines the 2.5% threshold in regards to “small systems”, in practice the 2.5% threshold is applied to systems of all sizes. Stratus Consulting, Affordability Assessment Tool for Federal Water Mandates (Boulder, CO: U.S. Conference of Mayors, American Water Works Association, and Water Environment Federation, 2013), https://www.awwa.org/Portals/0/AWWA/ETS/Resources/AffordabilityAssessmentTool.pdf
- 42Environmental Economics Advisory Committee of the Environmental Protection Agency Science Advisory Board, Affordability Criteria for Small Drinking Water Systems: An EPA Science Advisory Board Report, (Washington D.C.: United States Environmental Protection Agency, December 2002).
- 43“Drinking Water Requirements for States and Public Water Systems: Variances and Exemptions,” United States Environmental Protection Agency, accessed March 16, 2019, https://www.epa.gov/dwreginfo/variances-and-exemptions.; see also: “Variances and Exemptions: A Quick Reference Guide,” United States Environmental Protection Agency, accessed March 16, 2019, https://nepis.epa.gov/Exe/ZyPDF.cgi?Dockey=901U0I00.txt.
- 44“Drinking Water State Revolving Fund,” United States Environmental Protection Agency, accessed March 16, 2019. https://www.epa.gov/drinkingwatersrf.; “Clean Water State Revolving Fund,” United States Environmental Protection Agency, accessed March 16, 2019, https://www.epa.gov/cwsrf.
- 45“How the Drinking Water State Revolving Fund Works,” United States Environmental Protection Agency, accessed March 16, 2019, https://www.epa.gov/drinkingwatersrf/how-drinking-water-state-revolving-fund-works#tab-1
- 46For instance, the much-cited Mack and Wrase “Burgeoning Crisis” paper, (referenced in the introduction), and a 2005 proposal to the Detroit City Council to implement an income-indexed affordability plan both used existing EPA metrics as measures of affordability.
- 47Czerwinski, et al., Developing a Framework; Stratus Consulting, Affordability Assessment Tool.
- 48Manuel Teodoro, “Measuring Household Affordability for Water and Sewer Utilities,” Journal AWWA 110, no. 1 (January 2018), http://mannyteodoro.com/wp-content/uploads/2014/03/Teodoro-JAWWA-2018-affordability-methology.pdf
- 49Gregory Baird, “Water Affordability: Who's Going to Pick Up the Check?” Journal AWWA, (December 2010), http://www.agingwaterinfrastructure.org/SiteResource/Site_109155/Customize/Image/Water_Affordability.pdf.; Fisher, Sheehan, & Colton, "Defining "Affordable" Water Rates for Low-Income Affordability Programs," FSC's Law and Economics Insights 05-2 (March/April 2005), http://www.fsconline.com/downloads/FSC%20Newsletter/news2005/n2005_0304.pdf.
- 50Stratus Consulting, Affordability Assessment Tool.
- 51United States Congressional Budget Office, Future Investment in Drinking Water and Wastewater Infrastructure (Congressional Budget Office, November 2002), https://www.cbo.gov/sites/default/files/107th-congress-2001-2002/reports/11-18-watersystems.pdf
- 52Environmental Economics Advisory Committee of the EPA Science Advisory Board, Affordability Criteria.
- 53Czerwinski, et al., Developing a Framework.
- 54For this report I also conducted an independent literature review and interviews with experts and practitioners. My findings are in complete alignment with the National Academy of Public Administration’s findings regarding the critiques of EPA’s existing metrics and possible alternatives. Despite the independence of my own literature review and interviews, there was significant overlap with experts and authors used by NAPA. Because NAPA’s findings are presented as a meta-analysis, and because of NAPA’s unique position as a highly respected and objective organization chartered by Congress and tasked directly by the Senate Appropriations Committee to study this issue and provide recommendations to EPA, they will be referenced more heavily than other sources. It should be understood that a single citation to NAPA rests on input from a very wide variety of published and interviewed sources, both by them and independently by me.
- 55Czerwinski, et al., Developing a Framework, 44-45.
- 56Id., 52.
- 57Id., 48-49.
- 58Ken Kopocis and Cynthia Giles, Financial Capability Assessment Framework for Municipal Clean Water Act Requirements (Washington D.C.: United States Environmental Protection Agency, November 24, 2014), https://www.epa.gov/sites/production/files/2015-10/documents/municipal_fca_framework.pdf
- 59Kopocis, Financial Capability Assessment, 47-48, 177.
- 60Teodoro, Measuring Household Affordability; Stratus Consulting, Affordability Assessment Tool.
- 61“Panel Recommendation #1:… [m]etrics used should meet the following criteria: 1) readily available from publicly available data sources; 2) clearly defined and understood; 3) simple, direct, and consistent; 4) valid and reliable measures; 5) applicable for comparative analyses among permittees.” Czerwinski, et al., Developing a Framework, 61.
- 62“Panel Recommendation #2:… elements defining the current component should be revised to: 1) include all water costs, not just selected clean water costs, to include all drinking water and clean water costs… 2) focus on the income of low-income users most vulnerable to rate increases rather than Median Household Income; 3) identify the size of the vulnerable users relative to the utility’s total rate payer base.” Czerwinski, et al., 62.
- 63Czerwinski, et al.,177.
- 64Stratus Consulting, Affordability Assessment Tool.
- 65Id., 4.
- 66This analytical choice was made because GLWA and DWSD report costs, volumes, and revenues according to retail grouping and wholesale grouping, rather than residential grouping and commercial grouping in financial, operations, and capital planning documents. Without access to internal computer systems, it is not possible to identify the residential share of costs, nor is it possible to review the RI screen done by EPA for DWSD/GLWA’s National Pollutant Discharge Elimination System permit. This does not impact the validity of this analysis, however, because use of average wastewater utility bill is guaranteed to include all costs the utility faces since Michigan law and the GLWA lease agreement set wholesale water rates at full cost pricing (many retail water bills even include line items for fixed costs and debt service). If anything, this improves the EPA metrics’ ability to detect unaffordability, making the fact that it still fails to do so all the more robust a finding.
- 67In layman’s terms, this is akin to saying “I grant your framework these certain points that I would argue against, yet even with those concessions and still using your own framework, my conclusion holds.” A fortiori arguments are common with economists to demonstrate robustness of findings before presenting preferred models that more accurately reflect reality.
- 68Teodoro, Measuring Household Affordability, 15.
- 69Great Lakes Water Authority, 2017 Year in Review (Great Lakes Water Authority, 2017), https://www.glwater.org/wp-content/uploads/2018/08/GLWA_YIR_2017_final_digital.pdf; “About DWSD,” City of Detroit, accessed March 16, 2019, http://www.detroitmi.gov/Government/Departments-and-Agencies/Water-and-Sewerage-Department/About-DWSD
- 70Great Lakes Water Authority, 2017 Year in Review; City of Detroit, “About DWSD.”
- 71It is important to note that GLWA wastewater coverage does not extend to all of the communities served by drinking water infrastructure. Some of the calculations in this study will be forced to use wastewater costs provided by utilities outside of GLWA, such as the Genesee County Drain Commissioner. This study is intended to analyze affordability at the neighborhood and household level, so the inclusion of some costs outside of those imposed by GLWA is necessary, since it is still their customers whose budgets are impacted by these outside wastewater costs, which in turn impacts GLWA’s cost recovery efforts on these same households.
- 72“Geographic Terms and Concepts – County Subdivision,” United States Census Bureau, accessed March 16, 2019, https://www.census.gov/programs-surveys/popest/about/glossary/geo-terms.html; “Glossary – County Subdivision,” Census Reporter, accessed March 16, 2019, https://censusreporter.org/glossary/.
- 73“Water Questions and Answers,” United States Geological Survey, accessed on March 16, 2019, https://water.usgs.gov/edu/qa-home-percapita.html
- 74It is possible, even likely, that average usage varies between urban areas such as Detroit and rural areas in the rest of GLWA. However, the point of this analysis is to identify differences in structural affordability of water according to local characteristics, not to compute actual water consumption across jurisdictions. The goal is comparability between locations, so a single usage estimate for all communities is required. Where the usage estimate comes from is less important than the variance in cost according to that usage estimate.
- 75Average household size calculated for GLWA service area based on American Community Survey 5-year estimates for 2016.
- 76“Household Eligibility for WRAP Assistance,” Great Lakes Water Authority, accessed March 16, 2019, https://www.glwater.org/wp-content/uploads/2018/07/household-eligibility-for-WRAP.pdf
- 77Ten communities were not responsive to rate information requests after multiple telephone calls. They are represented as blank community boundaries in Figure 14 (see Appendix 1 for more details).
- 78Combined water and wastewater costs.
- 79Although Inkster does not break the combined 4.5% water and wastewater threshold community-wide, its sewer RI of 2.6% does breach the 2% threshold and a significant portion of its neighborhoods, represented in census tracts highlighted in the map, do break the combined 4.5% threshold.
- 80Kimberly Amadeo, “Federal Poverty Level Guidelines and Chart,” The Balance, last modified March 12, 2019, http://www.thebalance.com/federal-poverty-level-definition-guidelines-chart-3305843
- 81This number was selected because of the way income groups are reported in ACS table B19001, which breaks out income groups in $5,000 increments. $29,999 and below best corresponds to roughly $30,000 which, as pointed out above is roughly 150% of the federal poverty level for a family of 3 (a common threshold for public assistance benefits) and tracks roughly along with the MHI at which community-wide water and wastewater costs become unaffordable.
- 82Elizabeth A. Mack and Sarah Wrase, A Burgeoning Crisis.
- 84Detroit’s percent change is small compared to the others because so much of Detroit’s income distribution is situated towards the bottom end, so the shift from median to 20th percentile was not as radical a shift as for other communities.
- 85United States Environmental Protection Agency, Drinking Water Requirements for States and Public Water Systems: Variances and Exemptions, accessed March 16, 2019, https://www.epa.gov/dwreginfo/variances-and-exemptions; United States Environmental Protection Agency, Variances and Exemptions: A Quick Reference Guide, accessed March 16, 2019, https://nepis.epa.gov/Exe/ZyPDF.cgi?Dockey=901U0I00.txt.
- 86United States Water Alliance, An Equitable Water Future, 8.
- 87 a b Elizabeth A. Mack and Sarah Wrase, A Burgeoning Crisis.
- 88Blue Ribbon Panel, Final Report, 25;; WRAP Advisory Group, Water Residential Assistance Program: Program Design Report (Detroit, MI: Great Lakes Water Authority, August 2015), p. 6, http://www.detroitmindsdying.org/wp-content/uploads/2015/11/2015-8-WRAP-Program-design-GLWA.pdf
- 89Here, “public assistance” refers to all non-Social Security public assistance tracked by the Census Bureau in Table S19058, including: General Assistance (sometimes called “GA” or “welfare”), Temporary Assistance to Needy Families (or “TANF”), and Supplemental Nutrition Assistance (sometimes called “food stamps” or simply “SNAP.”)
- 90Here, “disability” refers to all disabilities tracked by the Census Bureau in Table S1810, including: hearing difficulty, vision difficulty, cognitive difficulty, ambulatory difficulty, self-care difficulty, and independent living difficulty.
- 91Some of the variability in these charts is due to differences in methodology, both between the decennial vs. ACS surveys and also between the 1/3/5-year estimates. However, each year in the chart follows the same methodology between locations, so that any variability is applied to each jurisdiction alike and overall trends still show through. The differences in census methodology mean that the actual scale of the year-to-year differences may be an artifact of methodological changes rather than actual population shifts, however, the spread between localities reflects actual proportional differences between them.
- 92The note of caution on interpreting year-to-year differences in the preceding chart applies to this chart as well.
- 93“We conclude that the fixed charge proposed for the Detroit Water affordability program meets both exceptions to the Headlee Amendment. It is a valid component of a user fee for water service, not a tax, under Bolt. And, regardless of whether it is a tax or fee, the discretion of the Board to implement affordability measures in its rate design predates the Headlee Amendment by over a century, and therefore is exempt from the Amendment as interpreted in American Axle.” Sean Flynn, Constitutionality of Water Affordability Program for Detroit (Wash. D.C.: Spiegel & McDiarmid, Sept. 26, 2005).
- 94Blue Ribbon Panel, Final Report, 4.
- 95Mich. Const. art. IX.
- 96Bolt v. City of Lansing, 587 N.W.2d 264, 279-81 (Mich. 1998).
- 97Id.
- 98Blue Ribbon Panel, Final Report, 12.
- 99Youmans v. Charter Township of Bloomfield, “Plaintiff’s First Amended Class Action Complaint,” (Mich. Ct. Ap. 2016), case no. 2016-152613-CZ, http://kickhamhanley.com/files/Youmans%20v%20Bloomfield/Plaintiff's%20First%20Amended%20Class%20Action%20Complaint%20(KH148925x9ECC1).pdf, accessed March 17, 2019; Anne Runkle, “Trial Over Bloomfield Township Water Bills Wrapping Up,” Oakland Press News, February 27, 2018, http://www.theoaklandpress.com/general-news/20180227/trial-over-bloomfield-township-water-bills-wrapping-up; Lisa Brody, “Split Decision in Water, Sewer Suit Against Township,” Downtown News Magazine, July 20, 2018, https://www.downtownpublications.com/single-post/2018/07/20/Split-decision-in-water-sewer-suit-against-township; Lisa Brody, “Plaintiffs Awarded $3.8 Million in Water Suit,” Downtown News Magazine, September 7, 2018, https://www.downtownpublications.com/single-post/2018/09/07/Plaintiffs-awarded-38-million-in-water-suit
- 100Crystal Proxmire, “Lawsuit Dismissed Against Village of Holly over Water and Sewer Fees,” The Oakland County Times, December 12, 2017, http://oaklandcounty115.com/2017/12/12/lawsuit-dismissed-against-village-of-holly-over-water-and-sewer-fees/
- 101Anne Runkle, “Bloomfield Township Supervisor ‘Confident’ that Lawsuit over Water Sewer Charges will be Dismissed,” Oakland Press News, June 28, 2017, http://www.theoaklandpress.com/general-news/20170628/bloomfield-township-supervisor-confident-that-lawsuit-over-water-sewer-charges-will-be-dismissed
- 102Anne Runkle, “Oak Park Vows to Take Fight Over Water, Sewer Charges to Michigan Court of Appeals,” Oakland Press News, June 28, 2017, http://www.theoaklandpress.com/general-news/20170628/oak-park-vows-to-take-fight-over-water-sewer-charges-to-michigan-court-of-appeals
- 10340 C.F.R. §35.2140(i)(1) (2015).
- 104Id.
- 105Id.
- 106U.S. Const. art. VI, § 2.
- 107City of New York v. FCC, 486 U.S. 57 (1988).
- 108The cost of shutting water off alone for Detroit totaled $5.6 million between 2013-2014 (Board of Water Commissioners “Contract No. DWS-894: Water Shut-off/Turn-on Project” April 24, 2013), and $7.8 million between 2018-2021 (Lara Moehlman, “Over 17,000 Households Could Face Water Shutoffs in Detroit,” Michigan Radio March 26, 2018). Staff time and resources devoted to collections and arrearage management is also a considerable cost, although no public estimate exists. It is not unreasonable to find these costs greater than that of a legal challenge, especially when savings from removing them are accounted for over the life of such a policy change relative to a finite legal case (including time discounting principles from benefit-cost analysis.)
- 109S. 3015, 115th Cong. (2018). Available at https://www.congress.gov/115/bills/s3015/BILLS-115s3015is.pdf, accessed March 17, 2019.
- 110S. 3015, 115th Cong. § 124(b)(1). Available at https://www.congress.gov/115/bills/s3015/BILLS-115s3015is.pdf, accessed March 17, 2019.
- 111S. 3015, 115th Cong. § 124(a)(1). Available at https://www.congress.gov/115/bills/s3015/BILLS-115s3015is.pdf, accessed March 17, 2019.
- 112S. 3015, 115th Cong. §§ 124(a)(1)-(b)(1). Available at https://www.congress.gov/115/bills/s3015/BILLS-115s3015is.pdf, accessed March 17, 2019.
- 113US EPA Water Infrastructure and Resiliency Finance Center, Drinking Water and Wastewater Utility Customer Assistance Programs (US EPA, April 2016), https://www.epa.gov/sites/production/files/2016-04/documents/dw-ww_utilities_cap_combined_508.pdf
- 114US EPA Water Infrastructure and Resiliency Finance Center, Drinking Water and Wastewater, 7.
- 115Blue Ribbon Panel, Final Report.
- 116Blue Ribbon Panel,12, 21, 23.
- 117Blue Ribbon Panel, 25.
- 118Blue Ribbon Panel, 7.
- 119Great Lakes Water Authority, Water Residential Assistance Program (WRAP) Opportunities, June 6, 2017, https://outreach.glwater.org/LinkClick.aspx?fileticket=8tNKy2oZeyQ%3D&tabid=39; “Community Action Alliance WRAP,” Wayne Metro, accessed March 16, 2019, http://www.waynemetro.org/wrap/.
- 120GLWA offers WRAP to individual communities. Individual communities must sign up to receive funds to then distribute to individual households that meet eligibility criteria. Communities have the option of engaging WRAP at one of three “Option Levels” with varying benefits to households. Option 1 includes the benefits listed above. Option 2 includes all but arrearage assistance, and Option 3 includes everything but arrearage assistance and bill credits.
- 121Great Lakes Water Authority Audit Committee, GLWA Audit Committee Meeting e-Binder (GLWA, April 2018), https://www.glwater.org/wp-content/uploads/2018/08/GLWA-Audit-Committee-Meeting-e-Binder-April-2018.pdf GLWA, 2017 Year in Review.
- 122Stafford, Controversial Water Shutoffs.
- 123GLWA Audit Committee, Audit Committee Meeting e-Binder.
- 124GLWA, 2017 Year in Review.
- 125UNC Environmental Finance Center, Navigating Legal Pathways to Rate-Funded Customer Assistance Programs (Chapel Hill, NC: UNC School of Government, 2017), https://efc.sog.unc.edu/resource/navigating-legal-pathways-rate-funded-customer-assistance-programs-guide-water-and/
- 126WRAP Advisory Group, Program Design Report.
- 127Id.
- 128Assuming that only owner-occupied units directly pay water bills, although water costs do still indirectly impact rental prices and cost of public housing. This assumption is necessary to give a conservative estimate, but it is true that there are a proportion of renters who do directly pay water bills. Unfortunately, it is noted in the literature on this topic that identifying the proportion of renters who face costs directly is incredibly difficult, given data limitations.
- 129Households below 150% of poverty line calculated from ACS tables B19001 and B25003 by summing households in income groups below $29,999 and scaling that value by the percentage of owner-occupied units.
- 130See Analysis section above for estimates of the number of households residing in census tracts that breach the 4.5% affordability metric threshold both inside and outside of Detroit. These households would likely require WRAP assistance in the absence of an alternative rate structure.
- 131Detroit Water and Sewerage Department, DWSD 10/30/50 Plan (Detroit, MI: City of Detroit), accessed March 16, 2019, http://www.detroitmi.gov/Portals/0/docs/DWSD/DWSD_PlanFlyer.pdf.
- 132“Eligibility Requirements,” Water Access Volunteer Effort, accessed March 16, 2019, https://www.wavefund.org/elgibility-requirements.
- 133“How do I Keep my Water Flowing?” City of Detroit, accessed March 23, 2019, https://detroitmi.gov/departments/water-and-sewerage-department/bill-assistance-and-credits/how-do-i-keep-my-water-flowing
- 134“MDHHS Can Help with Temporary Assistance,” Michigan Department of Health and Human Services, accessed March 16, 2019, https://www.michigan.gov/documents/dhs/DHS-PUB-0783_233434_7.pdf.
- 135City of Detroit, How do I Keep my Water Flowing?
- 136Total WRAP funding for Detroit divided by the number of enrolled households: $1575959 / 3557 = $443.06
- 137US EPA Water Infrastructure and Resiliency Finance Center, Drinking Water and Wastewater, 7.
- 138Roger Colton, A Water Affordability Program for the Detroit Water and Sewerage Department (Belmont, MA: Fisher, Sheehan, & Colton, 2005), https://drive.google.com/file/d/0BxDX326T9LRxSGRHQUdTamlUekk/view.
- 139Blue Ribbon Panel, Final Report,16. Note that the report indicates DWSD claimed to need two or more years to update systems and business practices to facilitate updated billing practices. The present report is being published just over two years after the Blue Ribbon Panel report, so it is a proper time to revisit alternatives.
- 140Blue Ribbon Panel,17.
- 141Id.
- 142Blue Ribbon Panel, 20-24.
- 143These are commonly referred to as the “business case” for affordability programs.
- 144Blue Ribbon Panel, 44.
- 151Dominic Adams, “Flint Monthly Water and Sewer Bills Highest in Genesee County by $35,” MLive, June 1, 2014, http://www.mlive.com/news/flint/index.ssf/2014/06/post_386.html.
- 152Jiquanda Johnson, “Genesee County Water Customers Will See Rate Increase Again This Year,” MLive, May 27, 2016, http://www.mlive.com/news/flint/index.ssf/2016/05/genesee_county_water_customers.html
- 153United States Geological Survey, “How Much Water Does the Average Person Use at Home Per Day?” Water Questions & Answers, USGS, last modified December 2, 2016, https://water.usgs.gov/edu/qa-home-percapita.html.
- 154It is possible, even likely, that average usage varies between urban areas such as Detroit and rural areas in the rest of GLWA. However, the point of this analysis is to identify differences in structural affordability of water according to local characteristics, not to compute actual water consumption across jurisdictions. The goal is comparability between locations, so a single usage estimate for all communities is required. Where the usage estimate comes from is less important than the variance in cost according to that usage estimate.
- 155Average household size calculated for GLWA service area based on American Community Survey 5-year estimates for 2016.
- 156GLWA, Eligibility Guidelines.
- 157Teodoro, Measuring Household Affordability; Stratus Consulting, Affordability Assessment Tool.
- 158Czerwinski, et al., Developing a New Framework, 61.
- 159Jason Mumm and Julius Ciaccia, “Improving the Narrative on Affordability and the Measurements We Need to Take Us There” Journal AWWA 109, no. 5 (May 2017).
- 160Teodoro, Measuring Household Affordability.
- 161Janet Clements, Robert Raucher, Karen Raucher, Lorine Giangola, Michael Duckworth, Stacey I. Berahzer, Jeff Hughes, Scott Rubin, and Roger Colton, Customer Assistance Programs for Multi-Family Residential and Other Hard-to-Reach Customers (Denver, CO: Water Research Foundation, 2017), http://www.waterrf.org/Pages/Projects.aspx?PID=4557.