Our report "Unfair Shares" shows that the San Francisco Bay Area’s less racially diverse cities are not allocating their fair share of moderate- and lower-income housing.
Haas Institute researchers Heather Bromfield and Eli Moore determined that after controlling for population size, Bay Area housing allocations for moderate- and low-income residents are correlated with cities' white population percentages.
Analyzing housing data from 1999 to 2017 for all local jurisdictions under the authority of the Association of Bay Area Governments, the findings of the report raise legal questions about a potentially disparate racial impact in the Bay Area's current housing needs allocation methodology, elevating concerns about housing equity in other parts of California as well.
Download the report, Unfair Shares, here.
A spreadsheet showing all of the data used in the report can be downloaded here.
A press release about the report can also be viewed here.
-----------
Interactive Webmaps
Media coverage:
August 23, 2017: "White communities in the Bay Area have lower low-income housing goals, study finds" (The LA Times)
August 24, 2017: "Study finds whiter Bay Area cities are shirking their affordable housing goals" (San Francisco Business Times)
Introduction
Key Findings
- Between 2007 and 2014, local governments in the Bay Area permitted 99% of the needed housing units for Above Moderate income households, but only permitted 28%, 26%, and 29% of needed Moderate Income, Low Income, and Very Low Income housing units (respectively).
- 57% of local governments in the Bay Area permitted less than 25% of the total housing units needed for Moderate, Low, and Very Low income households between 2007 and 2014. Only 5% of local governments permitted between 75 and 100% of the Moderate, Low, and Very Low income housing needed, and only 8% permitted more than 100% of what was needed.
- Cities that stood out for their achievement of very low and low income housing goals include Oakley, San Leandro, Richmond, and Santa Clara County spheres of influence. On the other end of the spectrum Martinez, Fairfield, and Napa County and Solano County spheres of influence permitted less than 10% of the very low and low income housing units allocated to them.
- Local governments with higher percentages of white residents were more likely to have received lower allocations of moderate and lower income housing. Statistical analyses of the most recent housing goals set through the Regional Housing Needs Allocation process found that cities’ percentage white population was moderately associated with the number of moderate and lower income housing units that were allocated to local governments in the Bay Area.
- The percentage white population in cities was associated with the number of units allocated even after adjusting for city population size, strengthening the case that the region's less racially diverse cities are not being allocated their fair share of moderate and lower income housing.
- City racial composition and city median household income were not associated with cities permitting higher percentages of moderate and lower income housing units.
Introduction
THE BAY AREA, and California more broadly, is experiencing a housing crisis that is driven in part by a shortage of housing units affordable to moderate income, low income, and very low income households. According to the California Department of Housing and Community Development (HCD), 180,000 housing units need to be built each year until 2025 to meet statewide demand; by comparison, between 2005 and 2015 the state produced an average of 80,000 housing units annually.1
The development of new housing in the Bay Area has been dominated by production of units for wealthier residents, with the region producing 99% of the housing needed for Above Moderate income households, and less than a third of the housing needed for Very Low, Low and Moderate income households between 2007-2014. The constrained supply and increasing demand for housing has contributed to the current situation in which 31% of all Bay Area households are over-burdened by housing costs. The crisis most acutely affects the lowest income groups; for instance, more than half of the households earning $20,000-$35,000 annually (around minimum wage) are spending more than half their income on housing.2 This reality has a disproportionate impact on communities of color because of the historical barriers to affordable credit (and as a consequence, homeownership markets) and other pathways to housing.3 Rising housing costs have been linked to exacerbating segregation in recent years, as families of color are displaced to the outskirts of high-cost regions in order to find affordable housing.4 To shed light on how this crisis came to be despite state statutes that purport to ensure adequate housing growth, this report seeks to identify some of the bottlenecks in the regional housing planning process in the Bay Area, and to illuminate how the planning processes required by state law must be improved to promote racial equity and housing affordability. This report additionally highlights how some jurisdictions have shirked their responsibilities to promote adequate housing development. The analysis points to the need for improved accountability toward jurisdictions’ housing responsibilities and an improved method for distributing the responsibility of housing production.
The housing crisis most acutely affects the lowest income groups—more than half of the households earning $20,000-$35,000 annually (around minimum wage) are spending more than half their income on housing.
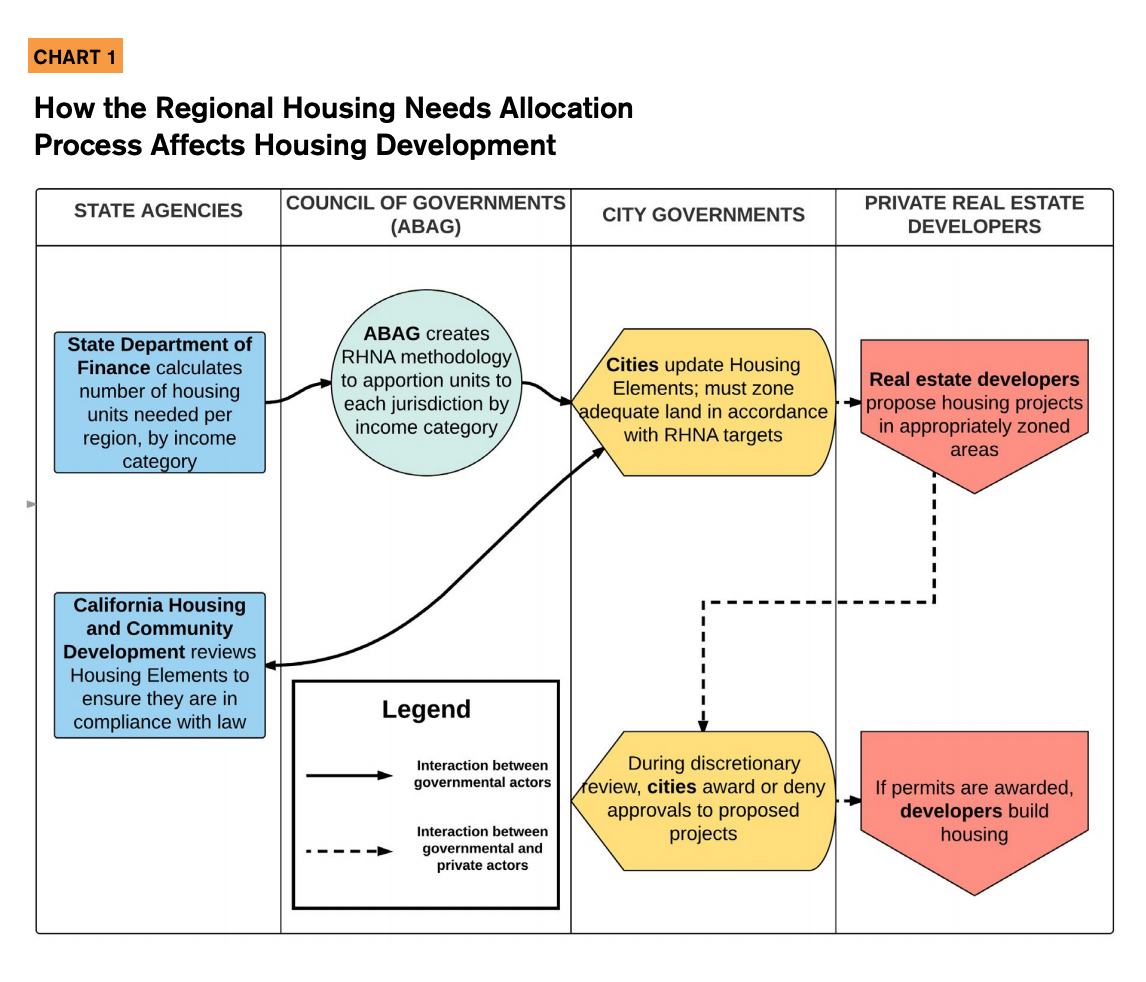
The California Housing Element law, passed in 1967, requires that each jurisdiction in the state adequately plan for existing and projected housing needs by identifying land where housing can realistically be constructed and by permitting a sufficient number of units. This requirement was established in an attempt to ensure that all Californians have access to housing they can afford in the areas where they live and work. Local governments are not, however, allowed to determine for themselves how much housing is “sufficient”; they must follow a process that involves the regional councils of governments (COGs), and state agencies. The process begins with the California Department of Finance calculating the future population growth and housing needed for each region in the state. The COG in each region then determines how much housing is needed in each city for each income category, and publishes this information in the form of Regional Housing Needs Allocation (RHNA). For the San Francisco Bay Area, the COG is the Association of Bay Area Governments/Metropolitan Transportation Commission (ABAG/MTC). Each local government in the region receives its housing “Allocation” and is, in turn, required to zone land so as to accommodate its portion of the region’s housing need. Each local government must identify sites that are considered suitable for housing development, report this information to the state, and issue the quantity of housing permits that matches their respective RHNA. This process is illustrated in Chart 1, below.
The process has been criticized at length because there are limited mechanisms to ensure that cities identify parcels that are actually realistic for housing development, and because there are no penalties issued to jurisdictions that issue insufficient numbers of housing permits.5 The lack of accountability in concert with local politics means minimal compliance in meeting housing goals. Lack of accountability of local jurisdictions is thus a contributor to the present housmethodology for determining allocations does not allocate enough housing to white, affluent jurisdictions that are opposed to affordable housing development, in effect giving these jurisdictions a “pass.” We analyzed how the RHNAs for the nine-county Bay Area and found that the local governments with higher percentage of white residents were allocated lower numbers of moderate and lower income housing during the 3rd and 5th RHNA Cycles, which respectively span the years 1999-2006 and 2014-2023.
Like every other region statewide, the Bay Area has ing crisis: while California’s population has grown dramatically in recent decades, housing supply has consistently lagged behind need—particularly for very low income, low income, and moderate income housing units.
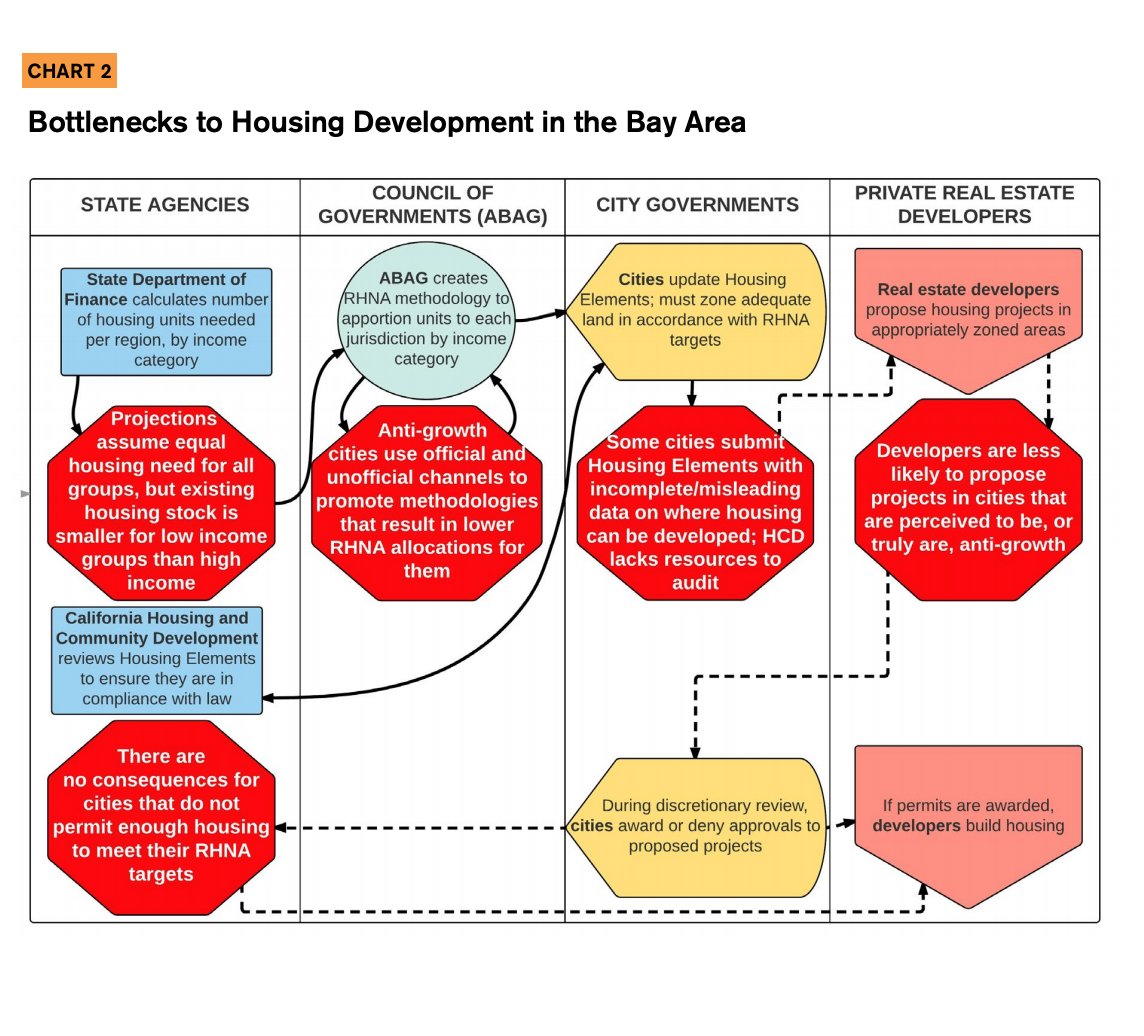
The California Community Partnerships team at the Haas Institute for a Fair and Inclusive Society affirms these existing critiques, but in this report raises an additional concern with RHNA in the Bay Area: the failed to permit enough units to meet housing demand. However, even if enforcement were tightened and Bay Area cities received greater incentives to permit additional housing, there will continue to be racially inequitable outcomes unless the Bay Area’s COG, the Association of Bay Area Governments/ Metropolitan Transit Commission (ABAG/MTC), takes steps to modify its RHNA methodology to affirmatively promote Fair Housing and desegregation, as required by the 1968 federal Fair Housing Act. Chart 2 below indicates how each stage of the RHNA process, at all levels of government, contains flaws and indicates why the current problem cannot be solved by enhancing enforcement on permitting alone.
In the first section of this report, we show how the number of units allocated—the goals set for how much housing each city or town should develop - varies among cities with similar population sizes but different demographic breakdowns. There are clear relationships between the number of units allocated, adjusted for population size of each city, and the racial composition of cities. In the second section we demonstrate the findings on the pervasiveness of under-permitting in the Bay Area during 1999- 2014 (the 3rd and 4th RHNA cycles). Finally, in the last section of this report we discuss some potential solutions that could help to eliminate the racial disparity in housing allocations while still meeting the region’s goals under SB 375.6 ABAG/MTC must address the racial disparities in subsequent RHNA cycles and when creating regional plans, including Plan Bay Area 2040, in order to comply with federal and state law and promote racial equity in the Bay Area region. We argue that instead of focusing exclusively on developing housing in priority development areas (PDAs), that ABAG/MTC should also prioritize housing in Transit Priority Project zones (TPPs) and in areas where there is a demonstrated lack of low income housing relative to the size of the low income workforce, in addition to prioritizing housing in PDAs.
Methods and Terminology
TO CONDUCT OUR ANALYSES, we combined publicly available data on Bay Area cities’ housing allocation numbers with publicly available U.S. Census Bureau data for median household income and racial composition. Using Pearson’s Correlation tests,7 we examined whether the demographic attributes were associated with the RHNAs for different income categories. Where historical data was available on permitting, we also used Pearson’s Correlations test to analyze whether there was any relationship between performance towards RHNA goals and city median income and city racial composition. Finally, we examined some of the cities which historically performed the best and worst relative to their RHNA targets.
In this report we utilize the following terminology (see the next column) to describe income levels and time periods.
Terms & Methodology
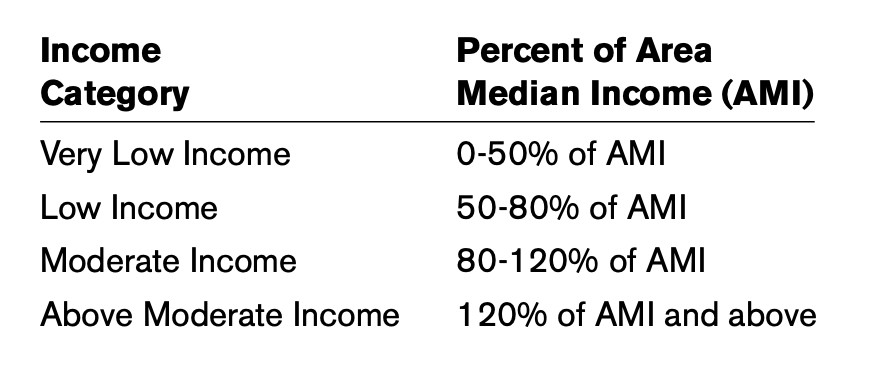
Area Median Income The California Department of Housing and Community Development annually determines affordability categories based on MSA-level8 median income data from the U.S. Department of Housing and Urban Development. Income categories are then constructed as a percent of the median income value, and RHNAs are developed based on the following percent ranges:9
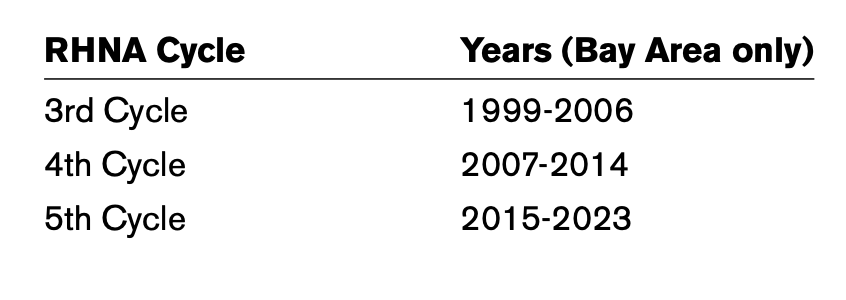
Regional Housing Needs Allocation (RHNA) Cycles The time period in which goals for housing development are set. The housing allocations are assigned to cities once every eight years, a time period that’s referred to as a “cycle.
Bay Area Housing Allocations
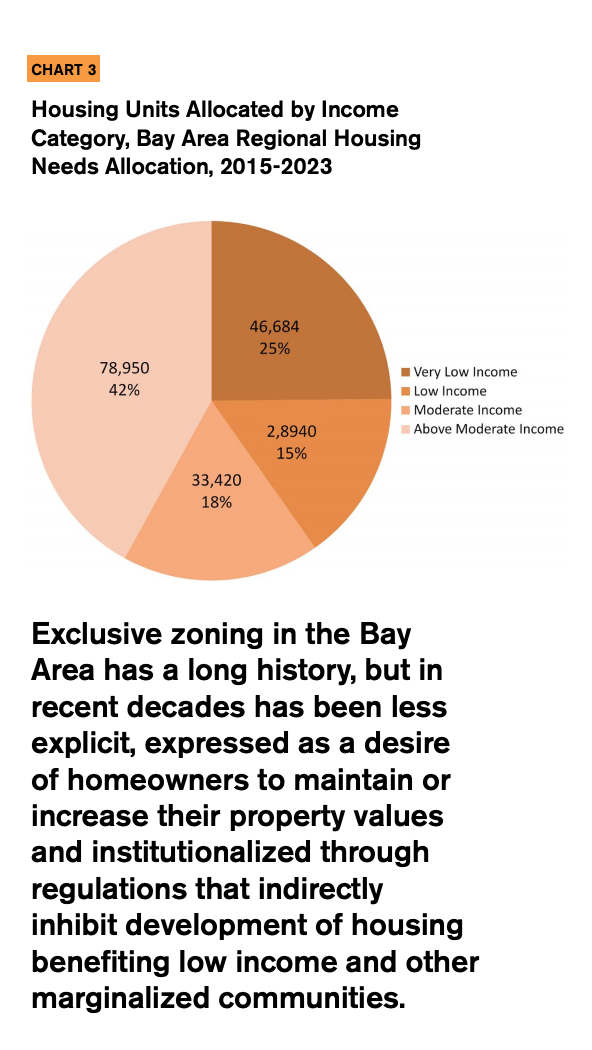
THE HOUSING ALLOCATION PROCESS in the Bay Area begins with ABAG/MTC developing a methodology to determine how many units each local government should develop for four categories of household income. This methodology is determined prior to each eight-year RHNA cycle. Chart 3 shows the number of housing units within each income category that the State Department of Finance determined the region needed between 2015 and 2023.
Our analysis of the Regional Housing Needs Allocations methodology tested whether there were correlations between the cities’ median household incomes, cities’ racial compositions, and the number of units that were allocated to each city. It is worth noting that statutorily, councils of governments are required to consider ten different factors, but there is no explicit mandate to prevent racially disparate impacts. Out of six possible methodologies that ABAG/MTC considered during the planning period of 2015-2023 (the 5th RHNA cycle), ABAG/MTC opted for the “equity scenario” that was anticipated to promote socioeconomic equity to a larger degree than other scenarios.
Our exploration into the racial and income dynamics of RHNAs was sparked by city planning research on exclusionary zoning. Exclusionary zoning refers to city practices that sharply regulate land uses and building codes, such as imposing stringent density restrictions, which have the effect of making housing more expensive. This results in restricting the number of low income residents and people of color who can afford to live within those jurisdictions. Exclusive zoning in the Bay Area and the rest of the United States has a long history, but in recent decades has been less explicit, expressed as a desire of homeowners to maintain or increase their property values and institutionalized through regulations that indirectly inhibit development of housing benefiting low income, homeless, reentry, and other marginalized communities.10
One way cities attempt to avoid affordable housing is to advocate for housing allocation methodologies which reduce the number of units that their jurisdictions are expected to produce. They additionally can opt not to designate areas of their jurisdictions as “Priority Development Areas.” Priority Development Areas (PDAs) are used to designate areas near transit stations where new housing development is to be concentrated according to the regional Plan Bay Area plan which ABAG/MTC updates every four years. Cities which have transit stations but which do not volunteer to create PDAs received dramatically lower housing allocations for the 5th cycle, which organizations such as Public Advocates and the Public Interest Law Project have argued since 2011 is a practice in violation of California’s Housing Element law.11 For these reasons, it is important to test to what extent race is associated with cities’ housing allocations.
Our analysis revealed that there were moderately strong relationships between the percentage of cities’ non-Hispanic white12 populations and the total number of units allocated in the moderate, low, and very low income categories (hereafter referred to as “moderate and lower income”), as explored in the next section.
Allocations and Race
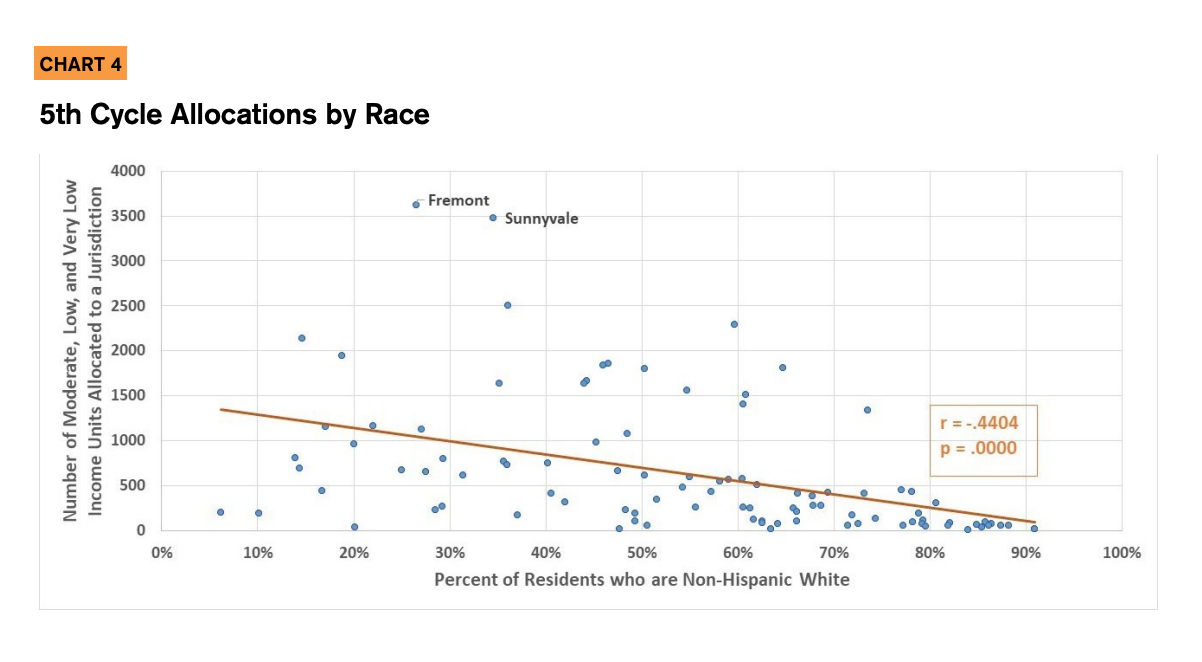
FOR THE CURRENT RHNA CYCLE, cities with higher percentages of non-Hispanic white residents clearly received lower RHNA allocations of moderate and lower income housing units; in fact, city demographics were more strongly associated with allocations than city median income. Chart 4 shows the relationship between the percent of non-Hispanic whites in a city and the number of units allocated for the moderate income and lower categories.13 14 The orange colored trend line in the chart shows that as the percentage of white residents goes up, the number of housing units allocated to that city goes down.
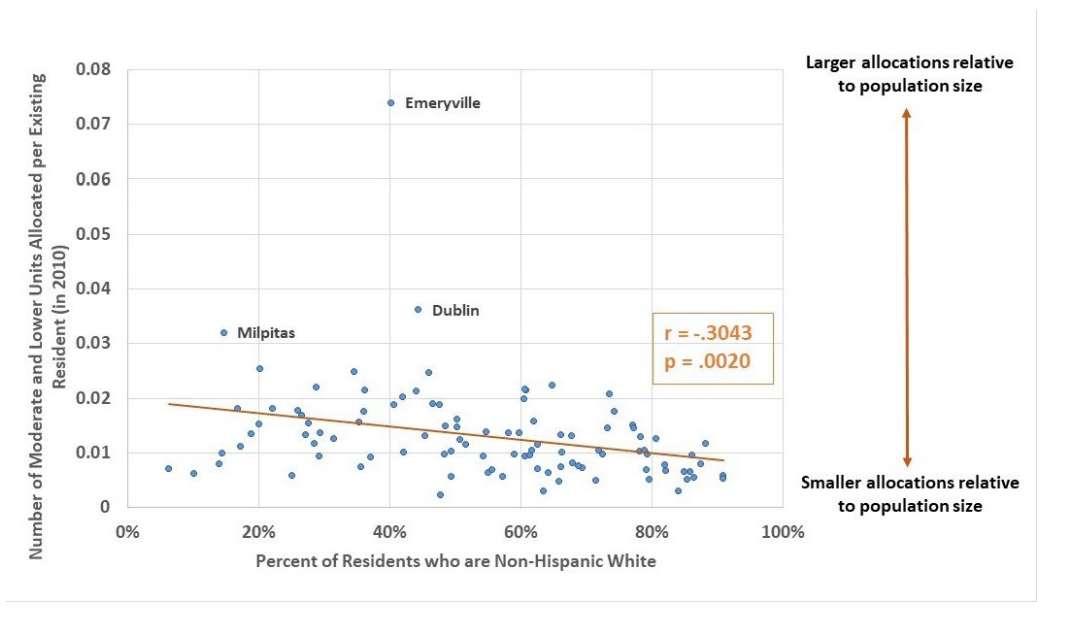
This pattern persists even after adjusting for the existing population size of each city, as seen in Appendix Chart 1.
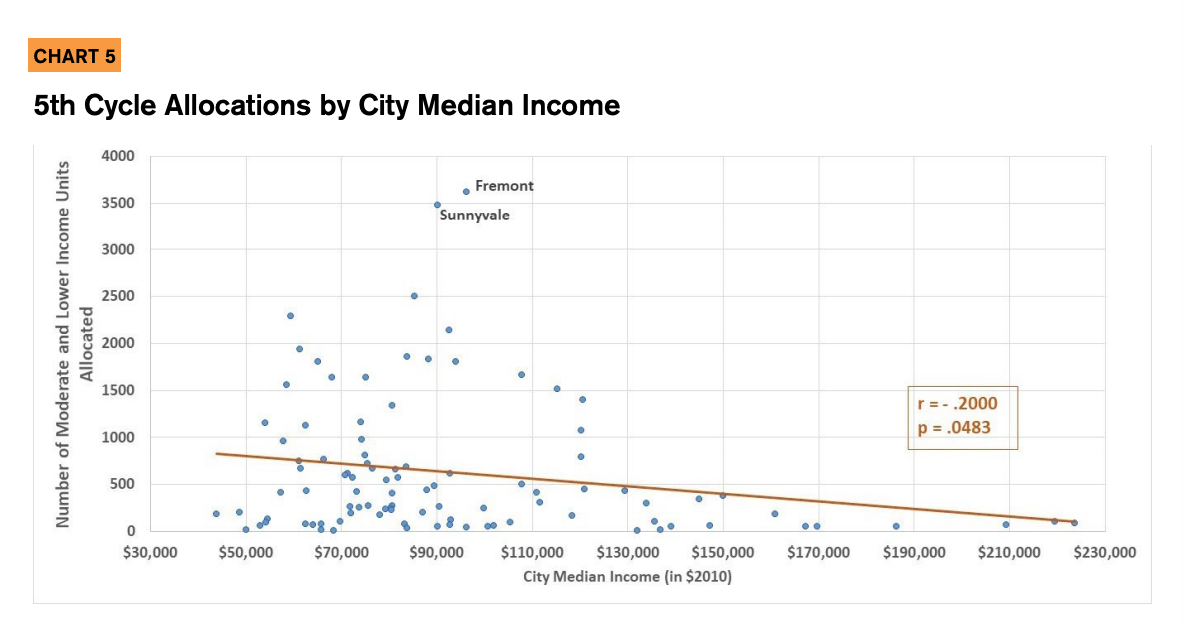
Chart 5 shows the relationship between cities’ median income and the number of housing units each city was allocated. The relationship between income and housing allocations is weak. As previously stated, race was more strongly associated with the number of units allocated to a city than income.15
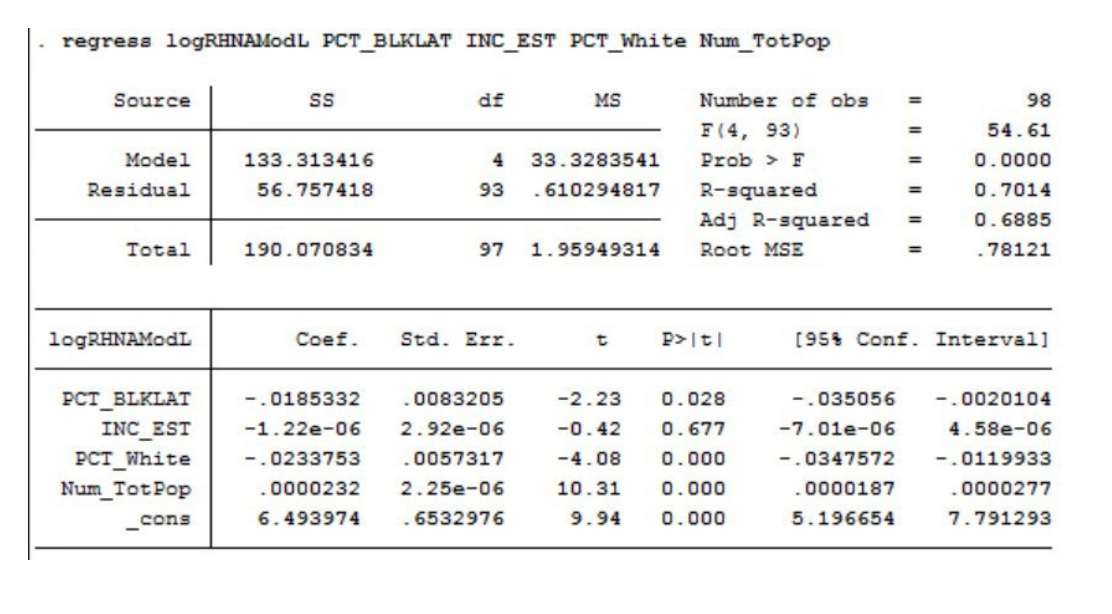
In addition to analyzing these bivariate relationships, we also utilized a multiple regression test to control for multiple variables at once. Our results from this test also demonstrated that there was a robust relationship between race and city allocation size when simultaneously controlling for income and population size, while income was consistently a statistically insignificant variable.16 These results are displayed in full in Appendix Tables 1 and 2.
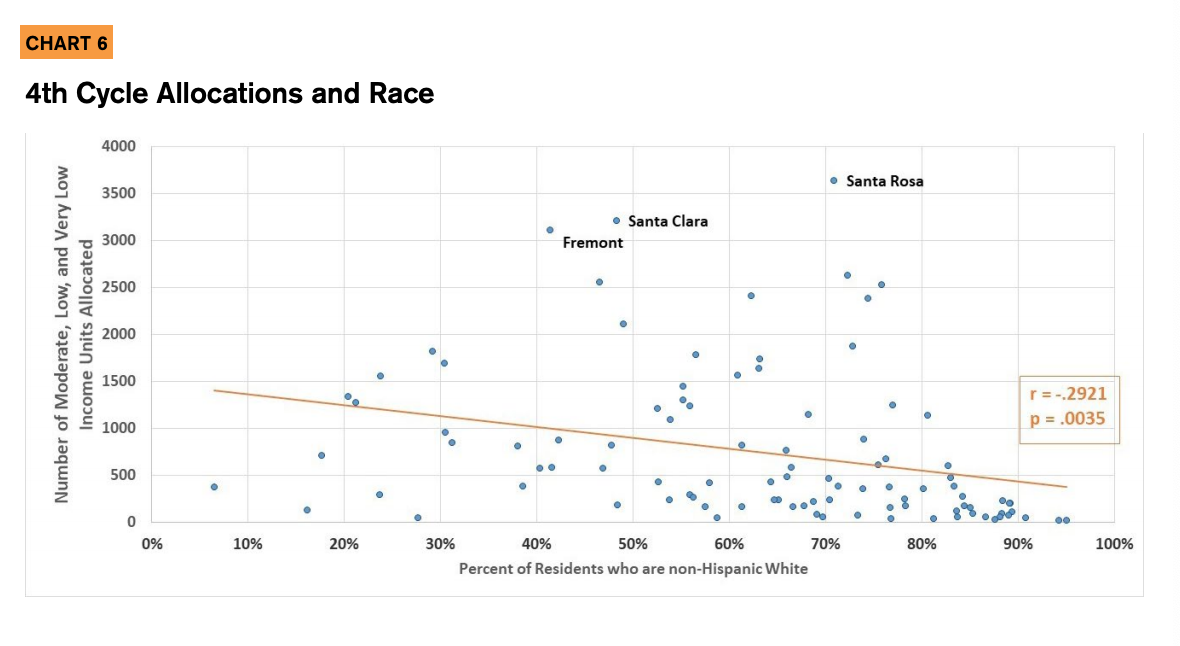
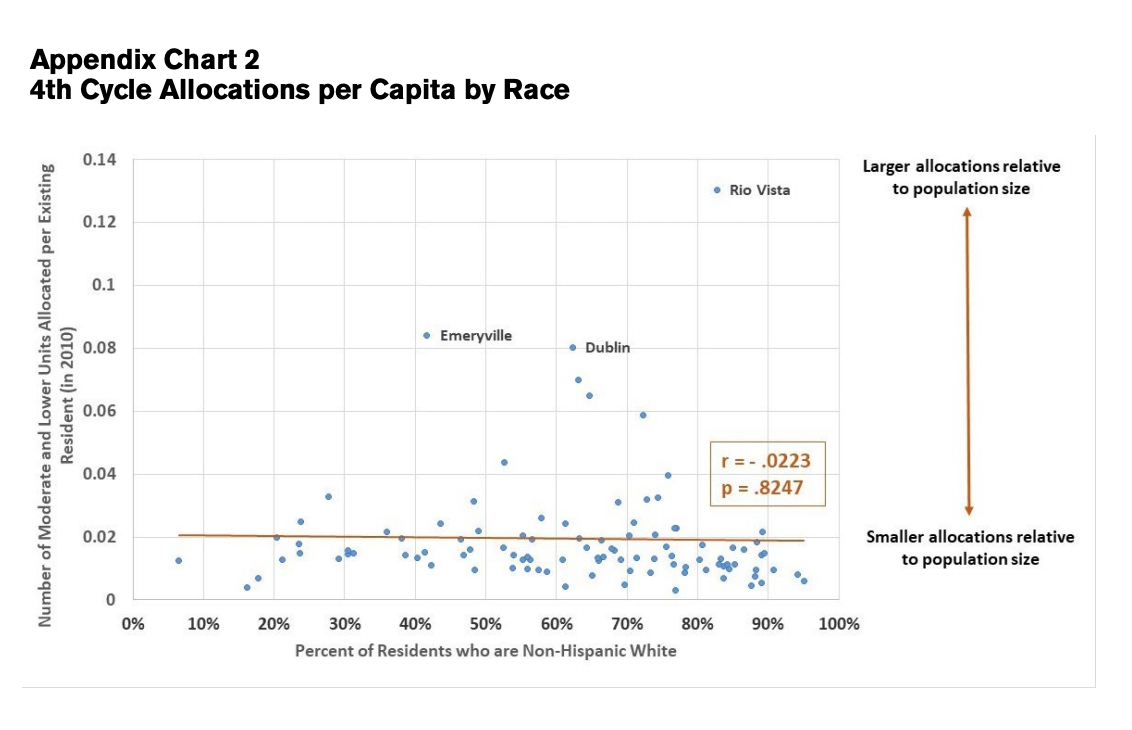
Cities with larger non-white populations do tend to have larger overall populations, but if population size were the only driver of RHNA allocations, our regression tests would show that race were no longer an important variable – but this is not the case. Additionally, in at least one previous RHNA cycle, the 4th Cycle, the relationship between city race and the number of units allocated relative to cities’ existing population size disappeared. This is despite the fact that there was still a relationship between percentage non-Hispanic white residents and the number of overall units allocated for the lowest three income categories. Chart 6 shows the relationship between race and the number of units allocated in the moderate and below income categories in the 4th Cycle, and Appendix Chart 2 demonstrates that there is no correlation between race and per capita allocations for moderate and lower income units during the 4th Cycle.17
These results strongly suggest that there was an inequitable allocation methodology in the 5th Cycle that minimized the obligation of jurisdictions with higher non-Hispanic white populations to produce housing, and that this outcome does not need to be a foregone conclusion.
Taken together, these results highlight the key role that whiteness plays in maintaining exclusive communities in the region. Differences in RHNA allocations across jurisdictions of similar population sizes cannot be explained away by the argument that more diverse cities tend to have lower incomes, or that more diverse cities are more populous. Furthermore, despite the fact that the existing income distribution is a factor that was explicitly taken into account in the calculations for the 5th Cycle methodology, income does not predict allocation size for moderate and lower income units, while race does.
Bay Area Permitting
ONCE CITIES SET OR UPDATE their Housing Elements of their General Plan to support the allocated number of housing units, they frequently have discretion as to whether they will permit proposed developments or not. Permitting is an important realm where city action or inaction can ameliorate or exacerbate the crisis of housing supply. The Bay Area, like every other region statewide, has consistently failed to permit a sufficient number of very low income, low income, and moderate income housing units, while permitting an adequate or more than adequate number of units for people with above-moderate incomes. In this section we explore overall permitting in the Bay Area and permitting of individual Bay Area Cities between 1999 and 2014.18
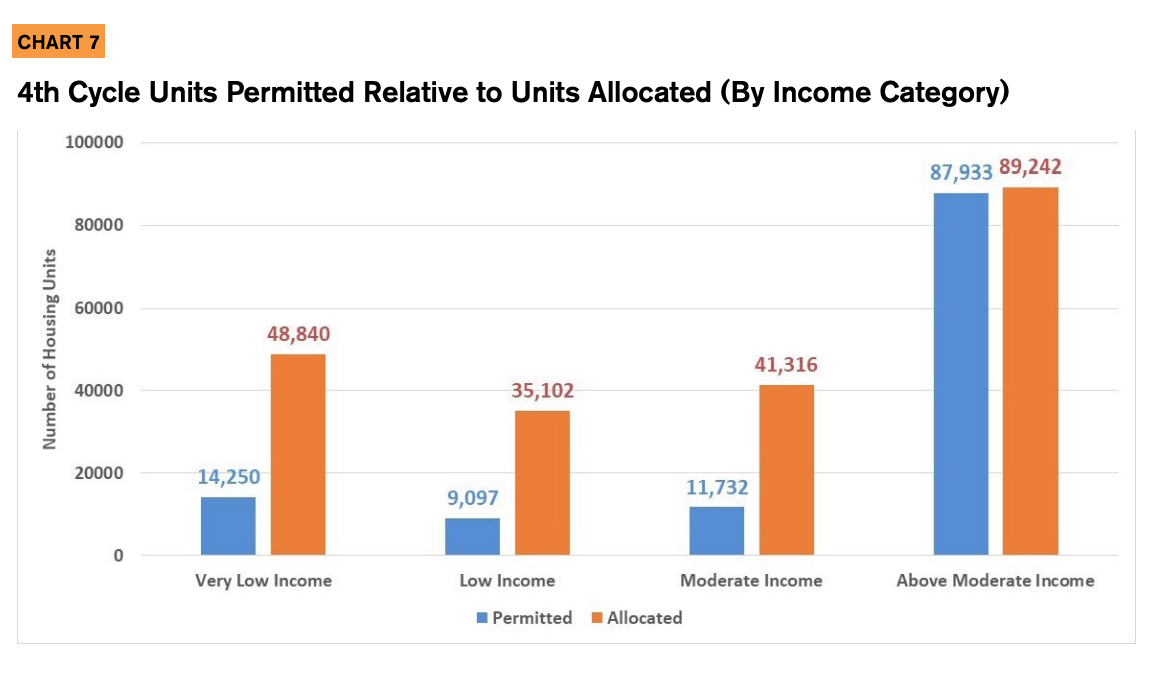
In Chart 7, we present the housing units permitted in 2007-2014 (the 4th RHNA cycle) alongside the number of units allocated in each income category across the nine-county Bay Area region. More than two thirds of the housing needed for Very Low, Low and Moderate households was not permitted and thus was not built. Bay Area cities permitted more than twice as many above moderate income units during this period than all of the other income categories combined.19
Bay Area cities permitted more than twice as many above moderate income units during 2007-2014 than all of the other income categories combined
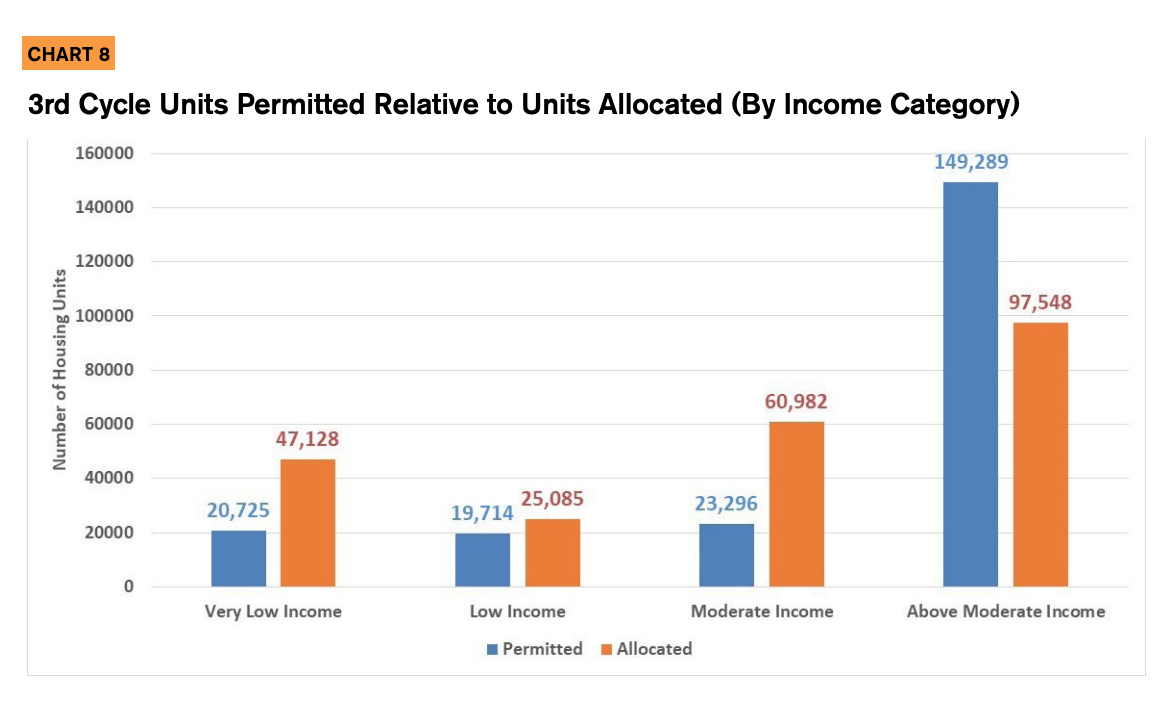
In Chart 8, we show that the number of permits issued by income category during the 3rd RHNA Cycle (1999-2006) were similar to the 4th cycle. A greater percentage of units were permitted in each income category relative to the 4th cycle, an outcome which may be largely attributable to the Great Recession coinciding with the 4th cycle years. However, in CHART 8 3rd Cycle Units Permitted Relative to Units Allocated (By Income Category) CHART 9 Percentage of Cities by Level of Allocated Moderate Income and Below Housing Units Permitted 2007–2014 (4th RHNA Cycle) the 3rd cycle, jurisdictions permitted 149,289 above moderate income units, which was 153% of the above moderate income allocation, and more than double the number of units that were permitted in all other income categories combined. Bay Area jurisdictions once again fell below their allocation targets for the moderate and below income categories.
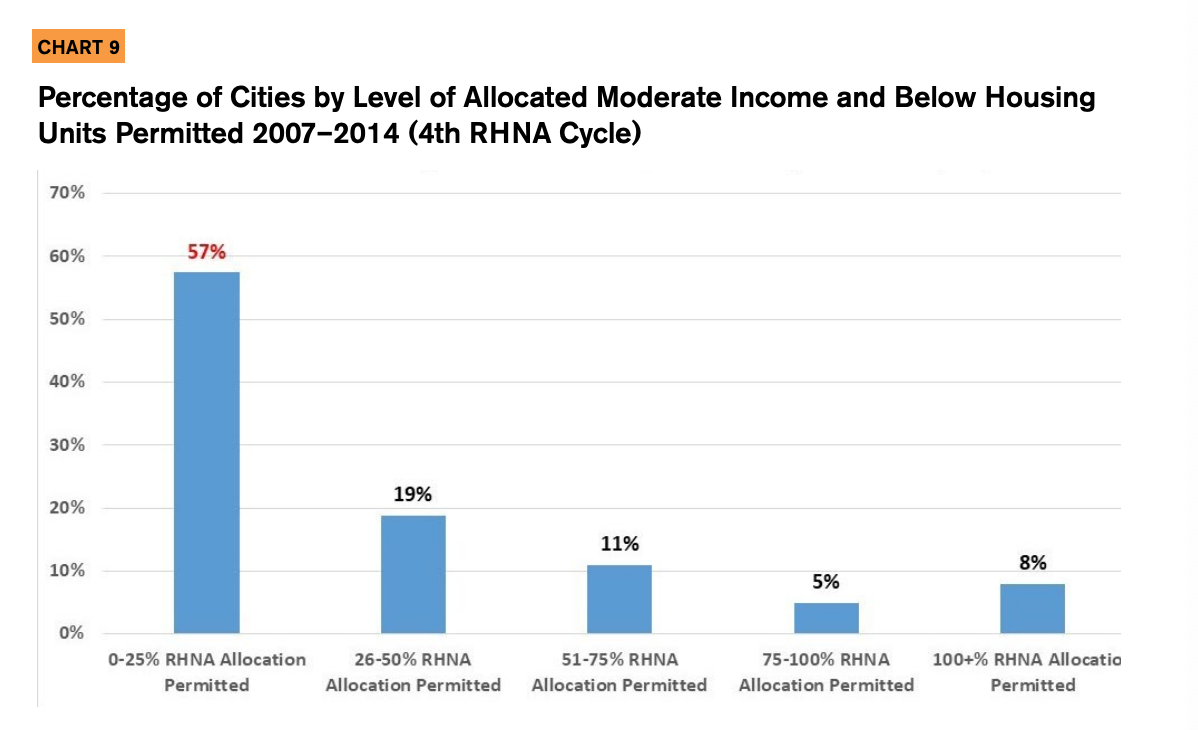
The regional numbers above, however, obscure the variation between cities as to what percentage of their very low, low, and moderate income units they permitted. Chart 9, below, looks at the percentage of moderate, low, and very low income units that each city permitted. As seen in Chart 9, 57% of Bay Area cities permitted between 0 and 25% of the total number of units allocated across these three lower income categories during 2007-2014. Furthermore, the overwhelming majority of cities permitted less than 75% of their allocated units for these three income categories.
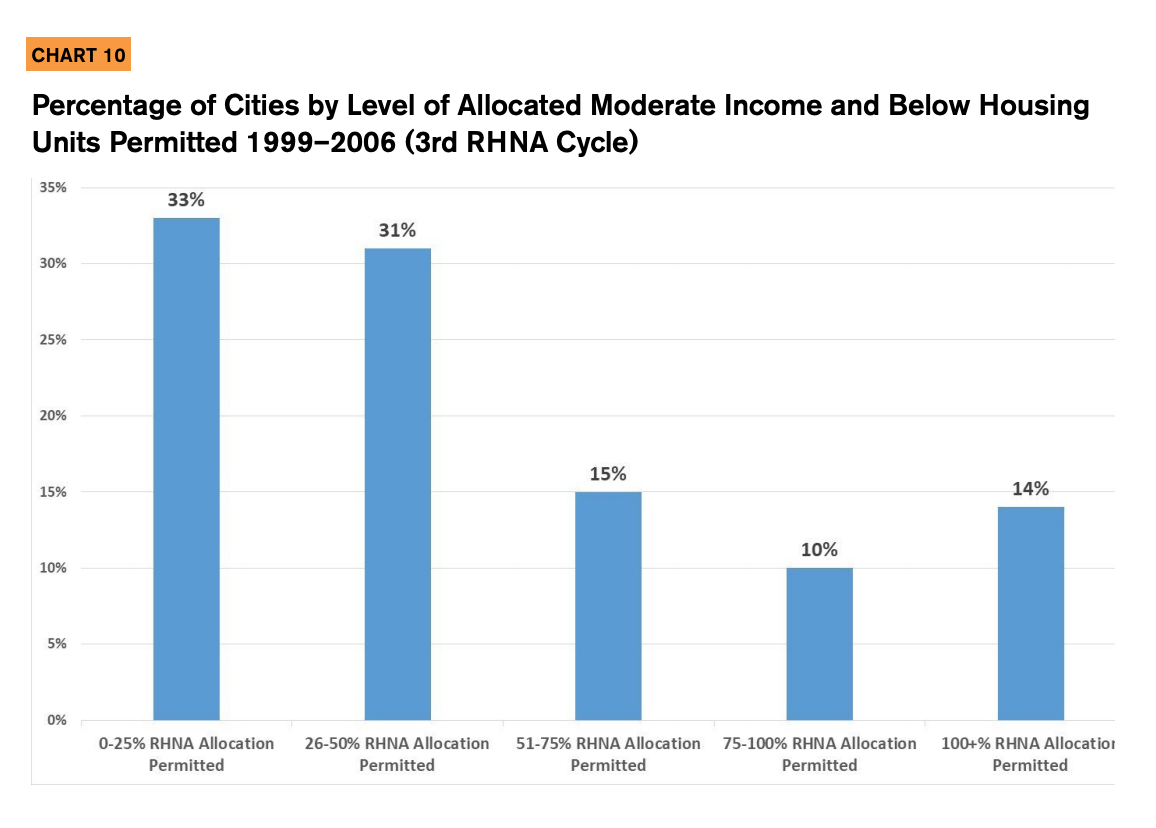
The results were slightly better for the 3rd Cycle (1999-2006), as shown in Chart 10: only a third of cities permitted between 0-25% of their allocated units for moderate, low income, and very low income units. However, in both cycles it is clear that an overwhelming majority of cities are not permitting sufficient units for these three income categories.
There are several explanations for the failure to permit sufficient very low income, low income, and moderate income housing. One of the most common explanations cites market forces as the core issue: the cost of building in California is high, and developers maximize their financial returns by producing housing for the highest income earners. Additionally, concurrent with the increased need for housing affordable to moderate and lower income earners, there has been a decline in federal and state money for subsidies for below-market rate housing, and a lack of incentives for developers to reach moderate and low income earners.
However, this data also points to an explanation for the under-permitting problem: as previously discussed, many jurisdictions do not want to build more affordable housing. Cities frequently respond to pressure from constituents not to permit additional housing during public comment periods, which means that even if the market is able to produce below market-rate development, there is increased uncertainty for real estate developers that they will actually succeed in getting permits issued. Private citizens are also able to bring the housing development process to a standstill by challenging proposed projects under California’s environmental laws. Community opposition and litigation add to the timeframe for housing development and raise the cost of producing housing. It is therefore crucial to acknowledge the key role that local politics plays in constraining the regional housing supply. In comparing cities’ relative success in facilitating the development of Above Moderate income housing, it is also important to recognize that land is a finite resource, and awarding permits for above moderate income housing projects precludes that land being use for projects that serve other income groups.
Permitting by Type of City
Knowing that there is a large degree of variation in cities’ progress in permitting of housing units against their respective RHNAs, we asked the following research questions: (1) are cities with higher median incomes permitting lower shares of their very low income, low income, or moderate income housing? And (2) are cities with larger percentages of non-Hispanic whites permitting smaller shares of their housing? Our results showed that in general city race and income alone were not associated with cities permitting a higher share of their allocated units, with some exceptions.
During 2007-2014 (the 4th cycle), jurisdictions with more non-Hispanic white residents were actually slightly more likely to permit their lower income housing allocations than non-white jurisdictions (r = .2642, p = .0079). Additionally, cities with higher median incomes were slightly more likely to permit higher shares of their lower income allocation than cities with lower median incomes in the 4th cycle, although the effect size was very weak (r = .1998, p = .0486). There were no relationships between city racial demographics and percent of RHNAs permitted for any other income category.
For the 3rd cycle, there were no statistically significant relationships between cities’ percent non-Hispanic white population and the percent of their RHNAs permitted for any income category. Similarly, there were no relationships between city median income and the percent of units permitted for any income bracket in the 3rd cycle.
These results indicate that the variability in cities’ performance in permitting their RHNA goals is not attributable to their demographic characteristics. We contend that this is because the overall allocations are the actual source of regional inequity; as a result, testing which demographic attributes correlate with the percentages of RHNAs permitted is akin to using a broken yardstick to measure cities’ achievements.
Over time, when cities that are opposed to affordable housing fail to permit their “fair shares” of lower income housing, more housing-friendly jurisdictions must pick up the slack in order to make meaningful progress towards making housing affordable for their constituents. Housing-friendly cities, as a result, are further burdened by the historical inaction of neighboring jurisdictions.
Historical Permitting: Cities with the Best and Worst Records
In this section we highlight the jurisdictions that have most effectively accomplished their housing goals for very low and low income households, and those with the worst records. We use the RHNA allocations here to measure cities’ housing performance, despite the problems with the allocations discussed above, because there are no other objective benchmarks available by which to measure cities’ housing outputs.
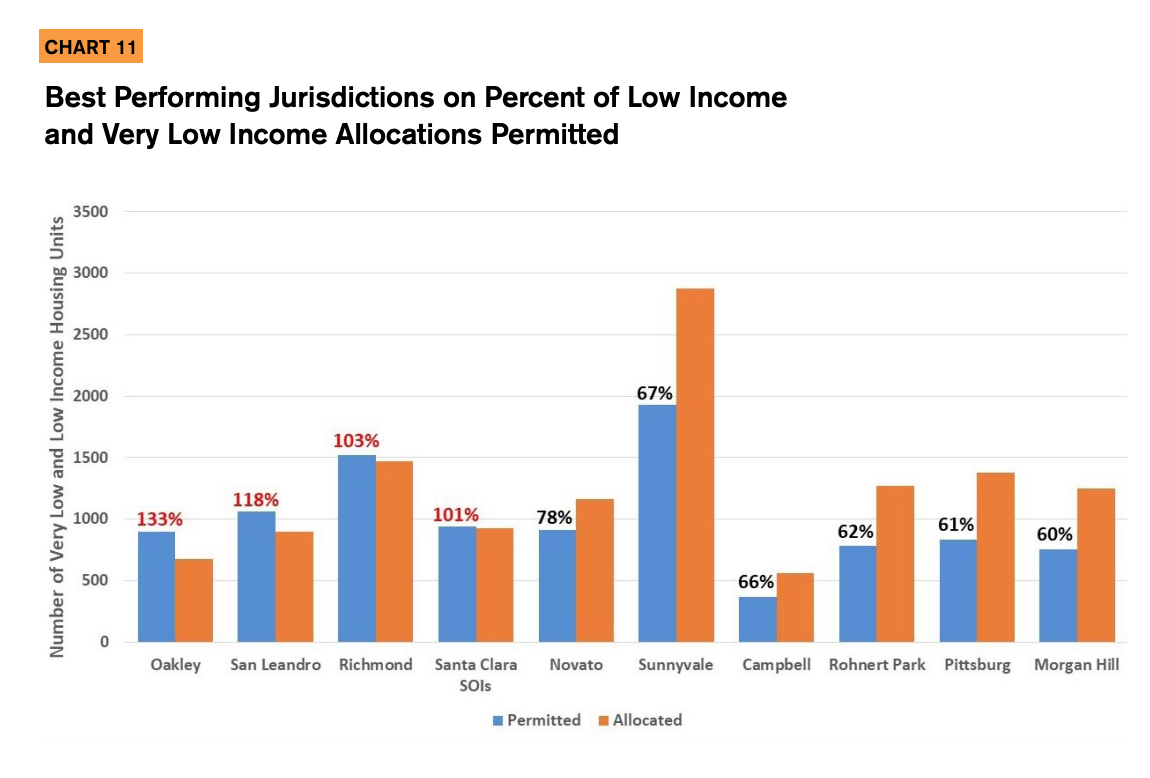
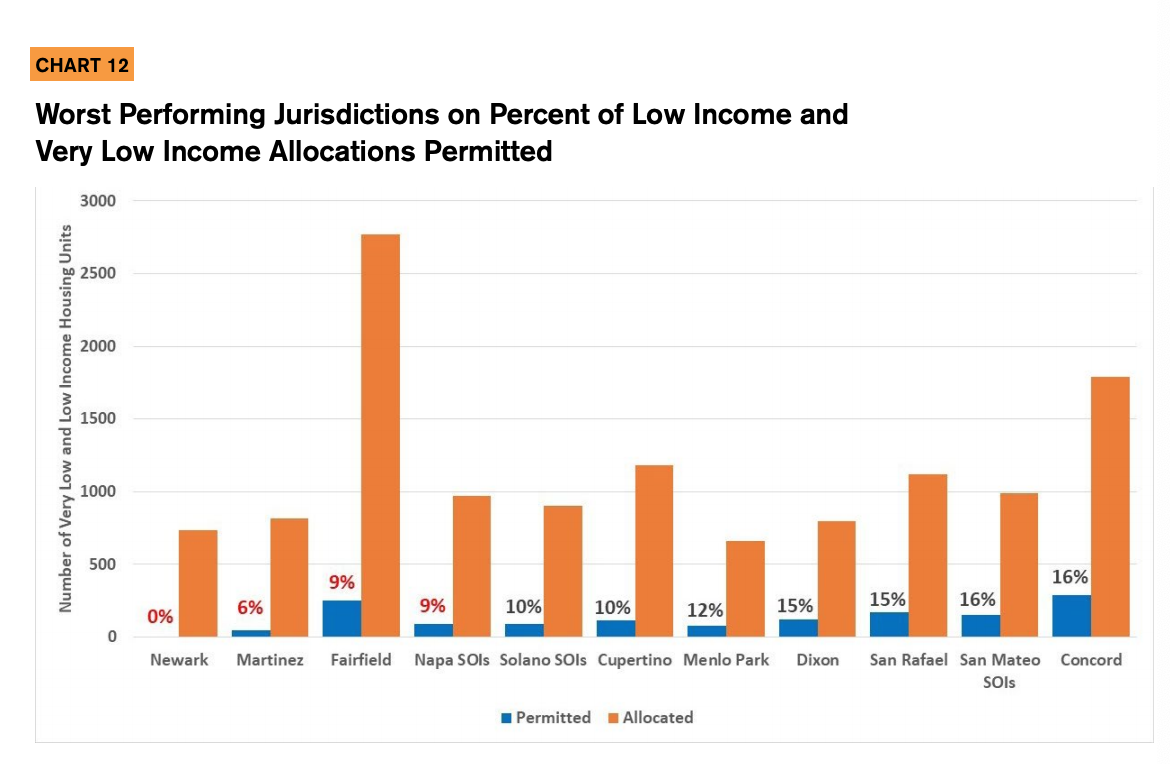
Chart 11 shows the jurisdictions that performed strongly in permitting their low and very low income allocations during 1999 to 2014 (the 3rd and 4th cycles combined). Jurisdictions were only included in this chart if their combined low and very low income unit allocations exceeded 500 units, since it is these jurisdictions’ permitting records that have a larger impact on the overall housing supply. While other cities with smaller allocations may have been able to permit more units as a percent of their allocations, these cities stand out for the high percent of units permitted despite having large allocations in two income categories that are well below the market rate value for housing, and partially during a time period that coincided with the Great Recession. Oakley, San Leandro, Richmond, and Santa Clara county spheres of influence all permitted more than 100% of their allocations, and therefore stand out as particularly committed to affordable housing development. By contrast, Novato, Sunnyvale, Campbell, Rohnert Park, Pittsburg, and Morgan Hill all fell short of their low and very low income RHNA targets by hundreds of units, yet they still performed better as compared to all other jurisdictions with large low and very low income allocations. In Chart 12, we see that the Newark, Martinez, Fairfield, Napa County spheres of influence and Solano County spheres of influence permitted few to no moderate and lower income units, drastically missing their RHNA targets.
Discussion
The relationships between city racial demographics and housing allocation numbers found in this report raise serious concerns about the process for determining housing allocations. Current legislative efforts are underway in the state capital to tighten oversight on jurisdictions and ensure that they are zoning enough land to meet their RHNA allocations. This is an important policy goal, but the results of this research show that imposing consequences on local jurisdictions who do not permit their RHNA allocations would reinforce the disparate racial impacts created by the methodology for distributing RHNA.
ABAG’s 5th Cycle methodology attempted to concentrate new housing that is affordable to low income households in areas with quality public transportation and access to jobs, which is an objective that we support and which should be prioritized in the future. However, concentrating housing development in these areas to a very high degree means that other areas of opportunity with access to jobs outside of PDA zones have been able to shirk their fair share responsibilities within their communities. Additionally, a study commissioned by MTC in 2015 determined that under current market conditions, it is infeasible for PDAs to support the amount of housing growth for which ABAG/MTC has planned.20
Methodological changes will therefore be needed to make RHNAs more equitable and to ensure that they are not in violation of the federal Fair Housing Act and state Fair Employment and Housing Act. If enforcement is tightened on jurisdictions to permit higher percentages of their allocations with no concurrent effort to adjust how these allocations are developed in the first place, the jurisdictions who will feel the greatest strain with regard to meeting the needs of Bay Area housing production will be cities with the highest non-white populations. Efforts to reform the Fair Share policy landscape should explicitly take these Fair Housing concerns into consideration.
Recommendations
Policy Solutions
Modify the Regional Housing Needs Allocation strategy to ensure racial equity
To resolve these issues within the current RHNA methodology, a revised allocation strategy should explicitly consider Fair Housing objectives and the regional distribution of opportunity. This will likely involve changing how ABAG/MTC currently takes Plan Bay Area into account when creating a RHNA methodology. Incorporating Plan Bay Area into RHNAs is required by SB 375, but there is considerable flexibility in how ABAG/MTC can incorporate this planning document into RHNAs, and during the 5th cycle this was largely done by allocating more housing to jurisdictions with PDAs.
We contend that although constructing housing in PDAs is one important strategy for reducing greenhouse gas emissions, an equally important way of achieving this goal is to reduce the number of workers who must commute daily into wealthy counties, such as Marin and Napa, because of the absence of low income housing options in non-PDA areas in those counties. Creating more low income housing options in Transit Priority Projects areas, in particular, would serve the explicit objectives of the Housing Element Law, which seeks to promote socioeconomic equity and improve the regional jobs-housing relationship. Furthermore, ABAG/MTC should explicitly consider existing research that maps the locations of affordable housing shortages in the Bay Area, which could result in simultaneously address desegregation, Fair Housing, and decreasing vehicle miles traveled.21
In the future, any attempt to balance housing production with climate change mitigation goals should promote racial and income integration, particularly by placing more weight on the jobs-housing mismatch and by testing whether any new methodology has a disparate racial impact, or if it is likely to augment concentrations of poverty.22 It stands to be noted that many PDAs are located in areas with fewer public resources, higher levels of environmental pollutants, and in many cases, lower overall levels of opportunity as defined by the California State Fair Housing Taskforce.24 As a consequence, in addition to furthering segregation and raising Fair Housing issues, the distribution of RHNAs in the Bay Area may reduce access to opportunity by restricting housing options for low income populations into a few relatively under-resourced jurisdictions.
In some cases, making progress towards transit-oriented development goals and improving income integration may involve constructing above-moderate income housing in gentrifying areas. It is crucial in these cases for jurisdictions to ensure that there are adequate renter protections in place to ensure that achieving these goals does not come at the expense of displacing existing residents. ABAG/MTC can play a role in this process by making funding for new development projects conditional on protecting existing residents. They can additionally continue to provide technical assistance to cities that promote increasing the supply of affordable housing, including density bonuses, inclusionary zoning, and affordable housing overlays. In low income areas, encouraging these sorts of development incentives for mixed-income housing may additionally help to reduce community opposition that has developed in response to market-rate development, and as a consequence may assist cities in meeting their housing production goals.
If enforcement is tightened on jurisdictions to permit higher percentages of their allocations with no concurrent effort to adjust how these allocations are developed in the first place, the jurisdictions who will feel the greatest strain in the Bay Area will be the cities with the highest proportions of people of color.
Strengthen accountability of regional Council of Governments’ RHNA process to state law
Several bills that are being considered for inclusion in a “housing package” in the California legislature as of August 2017 aim to increase accountability for jurisdictions that are not pulling their weight according to RHNA. One important way in which the legislation could ameliorate the inequities in the RHNA process is by giving HCD statutory authority to revise the allocation methodologies that councils of governments (COGs) produce in the event that the methodology does not comply with the Housing Element law. Furthermore, legislation could include more specific language regarding how the objectives of the Housing Element law should be factored into the allocation numbers, and what factors should receive the greatest weight. For example, a jobs-housing fit analysis could be added as a required aspect of the allocation methodology, and COGs could be required to test for disparate racial impacts before adopting a methodology. Changing the state statute would ensure that during the politicized process in which COGs develop allocation methodologies, that anti-growth cities are not able to lobby for methodologies that reduce their allocation sizes.
Further Research
Analyze City Practices for Facilitating Development of Moderate and Lower Income Housing
There is a enormous range of cities accommodating their share of moderate and lower income housing, with a few cities exceeding their allocations while most fall far short. This report analyzed these housing outcomes but did not explore the conditions, policies and practices that make the difference. Better understanding of how local governments proactively expand the production of affordable housing, and how others exert influence to prevent it, will help illuminate strategies to adapt across jurisdictions and specific measures to remove obstacles to affordable housing in the region. Such analysis should consider the interaction of local governments with the Regional Housing Needs Allocation process, examining the RHNA criteria and institutional decision-making in relationship to the particular conditions and agendas of local governments.
Analyze what made the 4th Cycle RHNA methodology produce more equitable allocations
Our analysis found that the RHNA methodology used for the 4th cycle produced more equitable allocations than in the 3rd and 5th cycles. While it is clear that the 5th Cyce methodology was developed with the SB 375 in mind, further research is needed to explore what went into the 4th cycle methodology that made it more equitable than the other two cycles, and how the Bay Area could return to a more equitable RHNA methodology without running afoul of state statutes.
Appendices
Appendix Table 1 Regression Analysis of Allocations by Income and Race
Note: The aggregate value of Moderate, Low Income, and Very Low Income RHNA units was adjusted using a logarithmic transformation. “PCT_BLKLAT” is the combined percent of African American and Latino residents; “PCT_White” refers to the percent of non-Hispanic white residents; “INC_EST” is the estimated household income; and “Num_TotPop” is the total population. San Francisco, San José and Oakland were excluded from this analysis as they are considered the “big three” by ABAG/MTC and receive higher allocations than any other city, which has a strong effect on the overall model fit. Income is the only variable that is not statistically significant in this model. The percent of non-Hispanic whites is a stronger predictor of RHNA allocations than the percent of African Americans and Latinos.
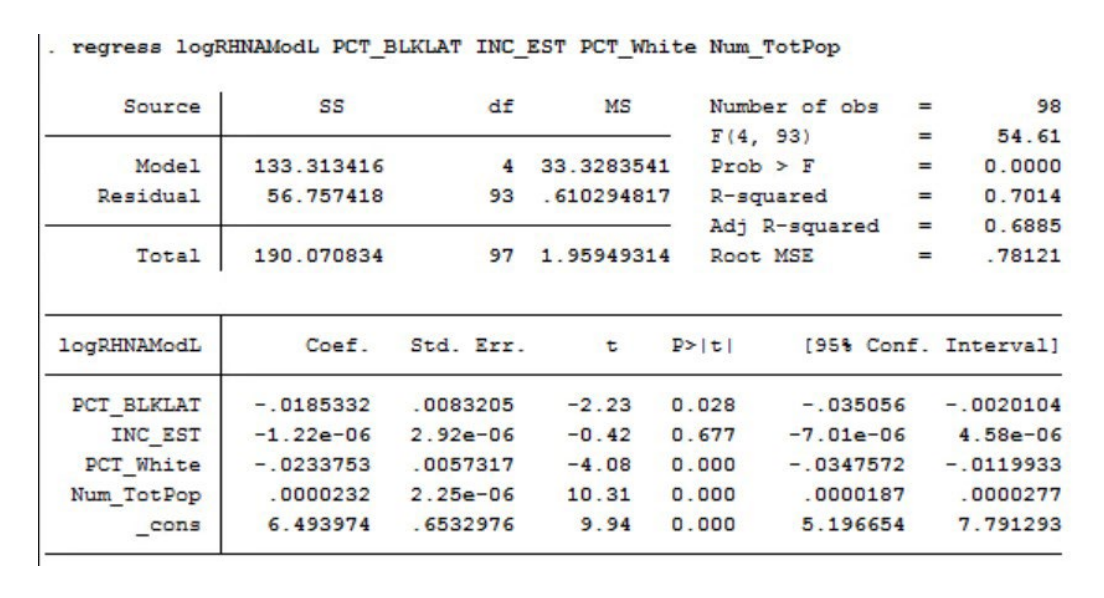
Appendix Table 2 Regression Analysis of Allocations by Race
Note: Removing household income from the analysis does not change the overall model fit.
Appendix Chart 1 5th Cycle Allocations Per Capita By Race
This chart shows the percent of non-Hispanic whites in each city plotted against per capita allocations (in other words, the number of units allocated to a city relative to the number of existing residents who live there). The trendline indicates that cities with higher proportions of non-Hispanic white residents are allocated lower numbers of moderate, low, and very low income housing units.
- 1California Department of Housing and Community Development, 2016. “California’s Housing Future: Challenges and Opportunities. Public Draft – Statewide Housing Assessment 2025.”
- 2Metropolitan Transportation Commission (2017). “2015 Housing Affordability by Income Level - Bay Area.” Accessible at http://www.vitalsigns.mtc.ca.gov/housing-affordability
- 3Rogers, Christy and john powell, 2013. Where Credit is Due. Lanham, MD: University Press of America.
- 4Urban Habitat, 2016. “Race, Inequality, and the Resegregation of the Bay Area.” Accessible at http://urbanhabitat.org/sites/default/files/UH%20Policy%20Brief2016.pdf
- 5California Legislative Analyst’s Office, 2017. “Do Communities Adequately Prepare for Housing?”
- 6With the passage of Senate Bill 375 in 2010, ABAG/MTC and other Councils of Governments are required to align RHNA production goals with the Sustainable Communities Strategy for the respective region, which encourages cities to increase density near transit stations. The Sustainable Communities Strategy for the Bay Area is called Plan Bay Area.
- 7Pearson’s Correlation tests are used to determine the association between two variables, or in other words, the extent to which an increase (or decrease) in one variable is associated with an increase (or decrease) in another variable. Higher “r” values indicate that there is a stronger association; r values of (+/-) .1-.3 are considered weak, while r values of (+/-) .3-.5 indicate that the association is moderate and r > (+/-) .5 indicates that the relationship is strong. “P” values indicate how statistically significant a relationship is, or in other words, what the chances are that the association is random, rather than due to the observed data. High p-values indicate that there is a greater chance that the association is random, meaning that the findings are less credible.
- 8Metropolitan statistical areas (MSAs) are geographies defined by the U.S. Office of Management and Budget and generally are comprised of multiple counties. For a map of MSAs in the Bay Area, see https://en.wikipedia.org/wiki/San_JoseSan_Francisco-Oakland,_CA_Combine…
- 9While it is outside the scope of this brief to address this issue at length, it is important to note that cities which have significantly lower median incomes than their respective county’s median income receive fewer allocations for very low income and low income units than they would if RHNAs were tabulated using each city’s median income. The “area median income” therefore underestimates low income housing need in counties with large degrees of income inequality, since the median does not indicate the full range of affordability needs.
- 10See, for example, Lens and Monkkonen, 2016, “Do Strict Land Use Regulations Make Affordable Housing Segregated by Income”; Ihlanfeldt, 2004, “Exclusionary Land-use Regulations within Suburban Communities: A Review of the Evidence and Policy Prescriptions”; and Pendall, 2000, “Local Land Use Regulation and the Chain of Exclusion.
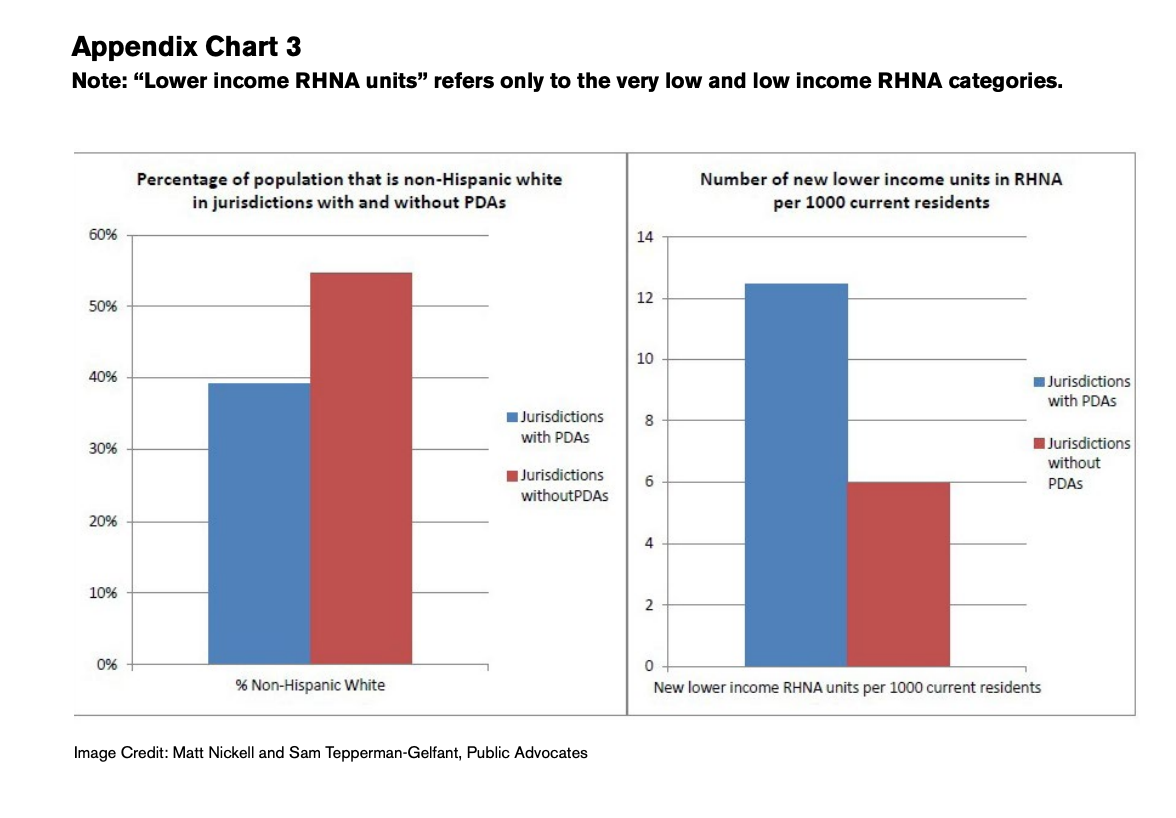
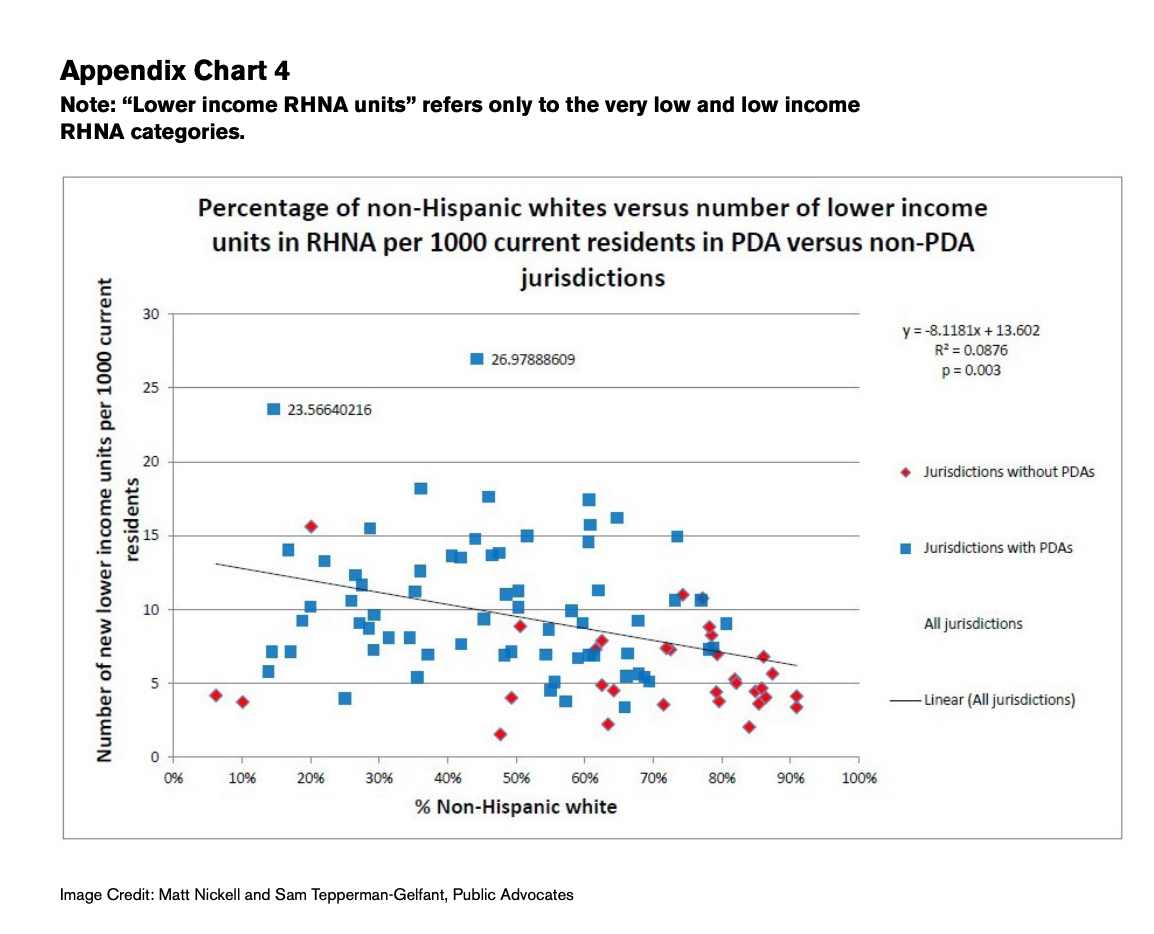
- 11During the 5th cycle planning period, 70% of housing growth was allocated to cities with PDA zones, with over 80% of that housing growth allocated to just 24 PDA jurisdictions. This means that a total of 56% of all 131,593 housing units are allocated to just 22% of the local jurisdictions in the region). This methodology was raised as problematic by public advocacy organizations in 2012-2013, who noted that PDAs were not substantively different from Transit Priority Projects (TPPs), yet similar housing allocations were not given to TPPs. However, the only major substantive distinction between PDAs and TPPs is that in the former case, cities opt-in for PDA designation, whereas in the latter case cities do not opt-in. As Public Advocates and the Public Interest Law Project have jointly pointed out, this results in a situation where housing allocations are essentially being determined by cities’ willingness to create housing, which is actually prohibited by state law. See Appendix Charts 1 and 2 for quantitative depictions of the racial composition of jurisdictions with PDAs versus those without PDAs.
- 12“Non-Hispanic White” is a demographic category used by the US Census Bureau to mean people who identify as white but do not identify as Hispanic.
- 13Note that San José, San Francisco, and Oakland were outliers for the purposes of this analysis with 20,849, 16,333, and 6,949 moderate, low, and very low income units allocated to them, respectively. Including these three cities skews the line of best fit considerably, meaning that these three cities alone disproportionately influence the line of best fit and the r values, and they were therefore removed from the Pearson’s correlation tests. When San José, San Francisco, and Oakland were included in the statistical test, the r value was -.2649 (p = .0074), meaning that the strength of the associated between race and allocations was weaker when including the two outliers.
- 14When testing the correlation between each of the unique income categories and the percent of non-Hispanic white residents, a greater percent of non-white residents consistently is associated with higher allocations for each income category. However, the strength of the association is weaker for higher income categories than it is for lower categories, meaning that more diverse cities receive greater allocations for low and very low income units. Above moderate (r = -.3806), moderate (r = - .3781), low income (r = - .3958), and very low income (r = -.4447).
- 15Three outliers, San Francisco, San José, and Oakland were dropped for the income analysis as well. With these three cities included in the analysis, r = -.1426 (p = .1550).
- 16Depending on the variables included, the percent of non-Hispanic white residents was variably a stronger or weaker predictor of allocation size than other racial group, such as the percent of Latino residents, percent of African American residents, or the combined percent of Latinos and African Americans.
- 17Note that San Francisco, San José, and Oakland were again outliers, with 19,271, 18,878, and 7,140 moderate income units and below, respectively, and they were therefore excluded from this analysis. When they were included, the results were r = -.2694 (p = .0065).
- 18We do not systematically analyze permitting in the 5th cycle because it only began two years ago. In the 5th cycle, the limited data available on permitting so far suggests that permitting will continue to fall far short of RHNA goals for the moderate income and below catego - ries. According to a 2015 publication commissioned by MTC and ABAG, this may be in part due to the lack of capacity in PDAs themselves for building the amount of units that ABAG is established as goals (see “PDA Assessment Update” report, accessible at http://mtc.ca.gov/sites/default/files/PDA%20Assessment%20Update%20Final…)
- 19These numbers do not reflect the fact that many proposed housing projects which received permits ultimately could not be built because financing fell through as a result of the Great Reces - sion.
- 20Economic & Planning Systems, Inc. (2015). “PDA Assessment Update.” Accessed at http://mtc.ca.gov/sites/default/files/PDA%20Assessment%20Update%20Final…
- 21California Government Code 65584(d).
- 22Benner, Chris, and Alex Karner (2016). “Low-wage jobs-housing fit: identifying locations of affordable housing shortag - es.” Urban Geography.
- 24The State Fair Housing Taskforce was convened by the California Treasury Tax Credit Allocation Committee and the Department of Housing Community Development in 2017. The Taskforce is a coalition of researchers and policy ad - vocates, including the Haas Institute for a Fair and Inclusive Society, Enterprise Community Partners, California Housing Partnership Corporation, the Center for Regional Change at UC Davis, and sev - eral other organizations. The Taskforce will be publicly releasing maps in the late summer of 2017.