May 8, 2014
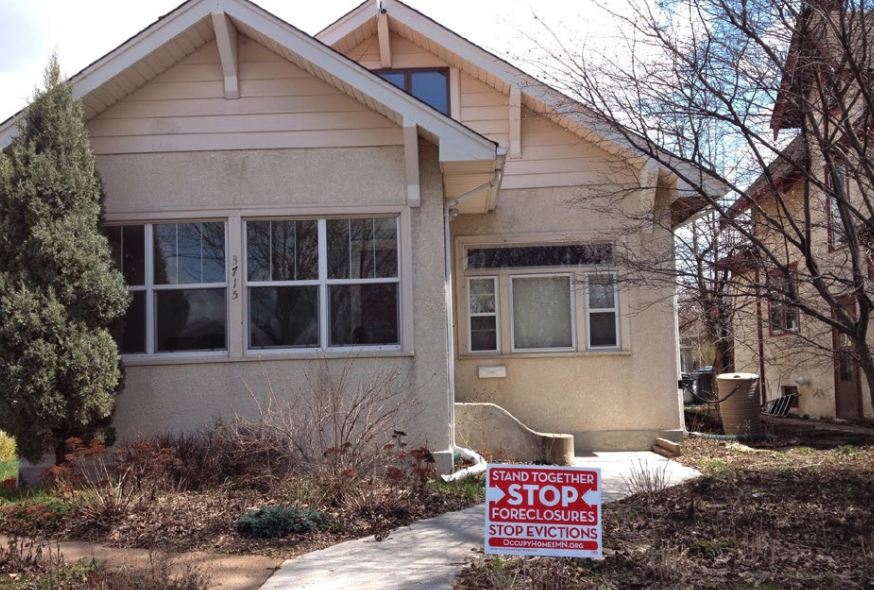
The report was launched at a national press conference on May 8, 2014 in Richmond, CA, in order to highlight the problem of widespread “underwater mortgages” – homeowners stuck in loans for more than their home is worth- which persists in many communities across the country. The report identifies the nation’s most troubled hot spots: the cities, metro areas and communities where the highest proportion of homeowners still have negative equity, or are “underwater.” The report’s authors argue that market forces alone will not bring the recovery to these severely impacted communities, and call for local or federal intervention to reduce mortgage principal.
Read a web version of the report here.
PRESS COVERAGE
NATIONAL
http://www.nationaljournal.com/next-america/economic-empowerment/college...
http://www.nytimes.com/2014/05/09/opinion/what-housing-recovery.html
http://www.reuters.com/article/2014/05/08/us-usa-housing-minorities-idUSBREA4713020140508
http://www.huffingtonpost.com/peter-dreier/post_7590_b_5313595.html
http://www.nytimes.com/2014/05/17/opinion/avoiding-foreclosure-a-view-from-the-treasury-dept.html
CALIFORNIA
http://blogs.kqed.org/newsfix/uc-berkeley-report-calls-for-action-on-underwater-homes
http://www.baycitynews.com/bcn/general/05/newsclip.14.05.09.21.51.00.1.txt
http://www.timesheraldonline.com/news/ci_25728872/vallejo-among-top-u-s-cities-mortgages-underwater
http://richmondstandard.com/2014/05/richmond/
http://www.recordnet.com/apps/pbcs.dll/article?AID=/20140510/A_BIZ/405130302/-1/a_biz
http://www.modbee.com/2014/05/13/3338939/stanislaus-countys-home-affordability.html?sp=/99/1623/
CONNECTICUT
http://www.ctpost.com/news/article/Bridgeport-lands-on-top-10-underwater-mortgage-5472872.php
http://www.rep-am.com/business/802799.txt
http://wnpr.org/post/homes-hartford-top-list-underwater-cities
http://connecticut.cbslocal.com/2014/05/09/hartford-hardest-hit-by-underwater-mortgages/
http://www.wfsb.com/story/25471944/report-hartford-top-city-with-underwater-mortgages
http://www.hartfordbusiness.com/article/20140508/NEWS01/140509915
http://www.ctnow.com/business/hc-hartford-underwater-mortgages-20140508,0,332458.story
http://wnpr.org/post/lawmakers-avert-legal-aid-cuts-q-poll-shows-gubernatorial-race-deadlocked
WISCONSIN
http://www.jsonline.com/blogs/purple-wisconsin/258542721.html
http://milwaukeecourieronline.com/index.php/2014/05/10/report-shows-housing-crisis-far-from-over-for-milwaukee/
http://milwaukeecourieronline.com/index.php/2014/05/17/state-action-needed-to-solve-milwaukees-foreclosure-crisis/
http://www.wisconsingazette.com/trending-news/tiny-homes-big-solutions.html
NEW JERSEY
www.njspotlight.com/stories/14/05/09/nj-still-drowning-in-underwater-mortgages-new-study-reveals
ST. LOUIS
http://www.kansas.com/2014/05/10/3449242/st-louis-area-hotspot-for-underwater.html
DETROIT
http://wdet.org/shows/craig-fahle-show/episode/homes-underwater-detroit/
http://metrotimes.com/news/news-hits/redefining-eminent-domain-1.1684933
MEMPHIS
http://www.bizjournals.com/memphis/news/2014/05/12/report-housing-recovery-is-skipping-memphis.html
ORLANDO
ATLANTA
http://atlantablackstar.com/2014/05/31/homeowners-color-still-underwater/
CHARLESTON, SC
http://www.charlestonchronicle.net/83287/2152/housing-recovery-ignores-black-and-latino-communities
In the first report of its kind, the authors analyze negative equity and foreclosure data together with race and income data, at a zip code level, as well as city and metropolitan area. The report uncovers the depth of the housing problem that persists in these hard hit communities, as well as how the legacy of predatory lending has meant a disproportionate negative impact on African American and Latino communities. One in ten Americans live in the 100 hardest hit cities where the number of underwater homeowners range from 22% to 56%, the report says.
REPORT AUTHORS: Peter Dreier, Professor of Politics and chair of the Urban & Environmental Policy Department at Occidental College; Saqib Bhatti, Fellow at the Nathan Cummings Foundation; Rob Call, graduate student in urban planning at the Massachusetts Institute of Technology; Alex Schwartz, Professor of Urban Policy at the Milano School of International Affairs, Management, and Urban Policy at The New School; and Gregory Squires, Professor of Sociology and Public Policy & Public Administration and chair of the Department of Sociology at The George Washington University.
RECOMMENDATIONS FROM THE REPORT
1. Loan holders—banks, government sponsored enterprises (i.e., Fannie Mae and Freddie Mac, which are regulated by the Federal Housing Finance Agency, FHFA), and investors—should reduce the principal on underwater mortgages to current market values.
2. If loan holders are unwilling or unable to reduce the principal on underwater mortgages to current market values, they should allow these loans to be purchased by publicly-owned or nonprofit entities that are willing to restructure them with fair and affordable terms.
3. Local municipalities should use all options at their disposal to facilitate the goal of resetting mortgages to current market values, including the use of “reverse eminent domain” (the program proposed in Richmond, California and elsewhere) to acquire mortgages in order to restructure them with fair and affordable terms.
4. Banks, government sponsored enterprises like Fannie Mae and Freddie Mac, and investors that own vacant homes that have already been foreclosed upon should sell them to publicly- owned or nonprofit entities that can convert them to affordable housing units for residents of the community instead of selling them to speculators.
5. Local municipalities should use all options at their disposal to facilitate the goal of turning vacant, foreclosed homes into affordable housing. This includes the use of “reverse eminent domain” to acquire properties in order to convert them to af- fordable housing units for residents of the community and to prevent them from being purchased by speculators.
Fact Sheets on Hardest-Hit Areas
View specific reports on the hardest-hit cities and neighborhoods.
EXECUTIVE SUMMARY
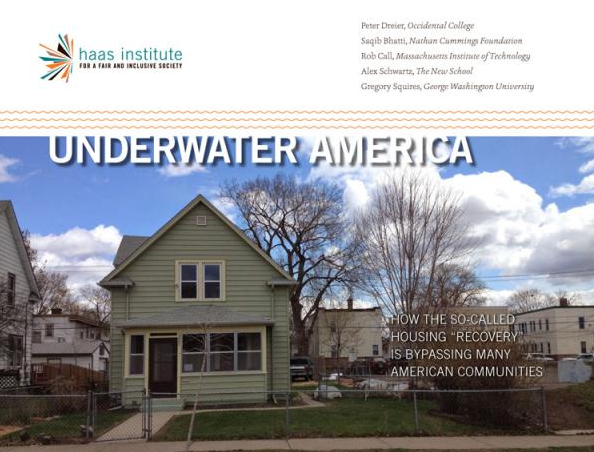
CONTRARY TO THE CLAIMS OF MANY observers that the recent rise in housing prices is solving the nation’s foreclosure and related economic crises, millions of families continue to face financial devastation from which many may never recover. This report examines national trends that are leaving many families behind and identifies the most troubled geographic “hot spots”– metro areas, cities, and neighborhoods in all regions of the country—where a significant portion of families are still “underwater,” which means they owe more on their mortgages than their homes are worth.
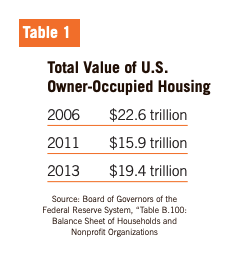
Despite home prices rising in many parts of the country, the total value of owner-occupied housing still remains $3.2 trillion below 2006 levels. Despite rising home prices, there are still some 9.8 million households underwater, representing 19.4 percent of all mortgaged homes—nearly one out of every five such homes. Underwater homeowners are significantly more likely to default on their mortgages than homeowners with positive equity
In the first report of its kind, we analyze negative equity and foreclosure data together with race and income data, at the ZIP code level, the city level and the metropolitan area level. The report shows that if we drill down to the neighborhood level, a startling number of communities across the country still face very high underwater rates.
The report also clearly shows that the legacy of predatory lending has resulted in a disproportionately negative impact on African American and Latino communities. For example, of the 100 cities with the highest underwater rates, in 71 of them the population is more than 40 percent African American and Latino.
Almost five million families have lost their homes to foreclosure since 2008, and foreclosures continue at rates higher than prior to the Great Recession. For African Americans and Latinos specifically, between 2005 and 2009, they experienced a decline in household wealth of 52 percent and 66 percent, respectively, compared to 16 percent for whites. This reflects, in large part, disparities in foreclosure rates among these groups, since for most Americans, and particularly for people of color, their homes are their largest source of wealth. Homeownership constituted 92 percent of the net worth for African Americans and 67 percent for Latinos, compared to 58 percent for whites.
While some communities across the country have benefited from rising home prices, this upward trend is expected to slow down dramatically in 2014, which means the hot spots that have been left behind by the recovery are not likely to see their fortunes substantially improve any time soon. Market forces alone will not bring the recovery to these severely impacted communities.
KEY FINDINGS
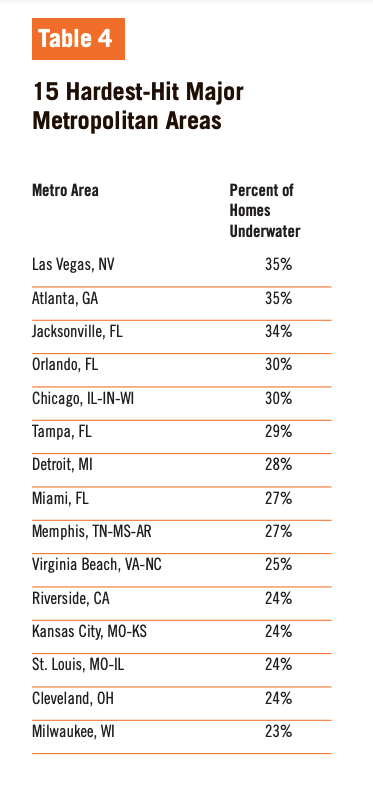
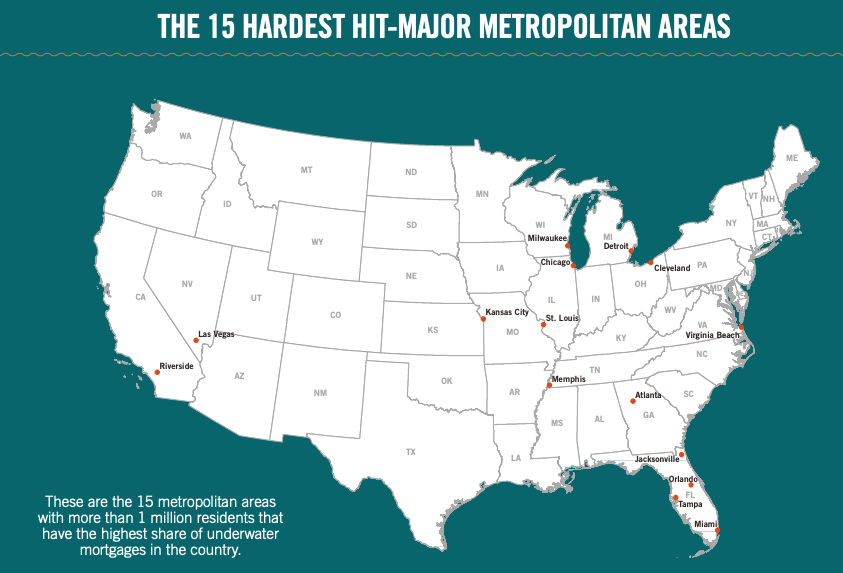
- In the 15 hardest-hit metropolitan areas with populations over one million, between 23 percent and 35 percent of homeowners are underwater.
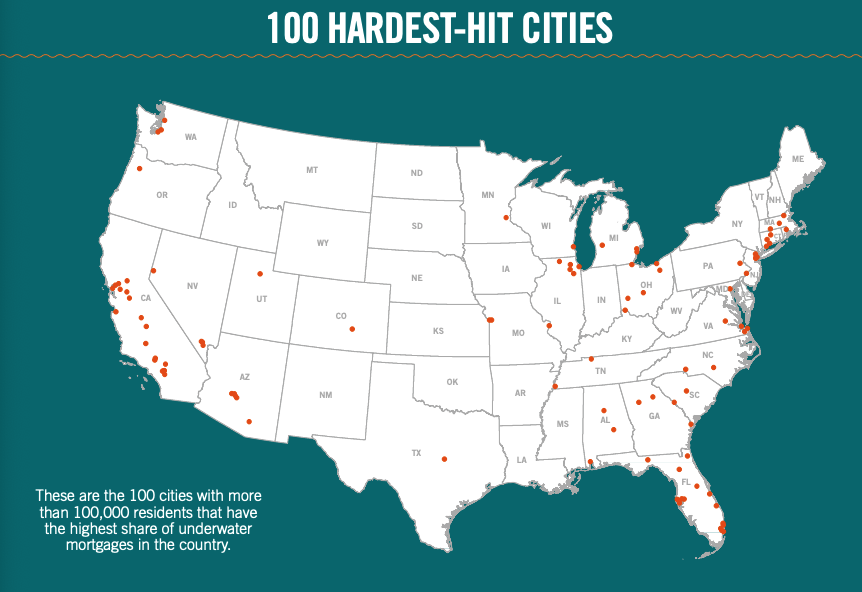
- One in ten Americans live in the 100 hardest-hit cities where the number of underwater homeowners ranges from 22 percent to 56 percent.
- More than 10 million Americans live in the 395 ZIP codes where between 43 percent and 76 percent of homeowners are underwater.
- In those metropolitan areas, cities, and zip codes that have been hardest-hit, African Americans and Latinos constitute a far higher share of the population than they represent in the total population in the US.
- In the 100 hardest-hit cities with populations over 100,000, the number of underwater homeowners ranges from 22 percent to 56 percent.
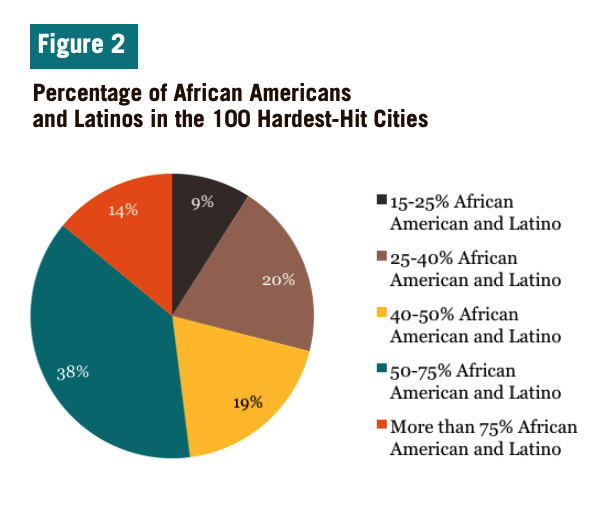
- In 71 of these cities, African Americans and Latinos account for at least 40 percent of the population.
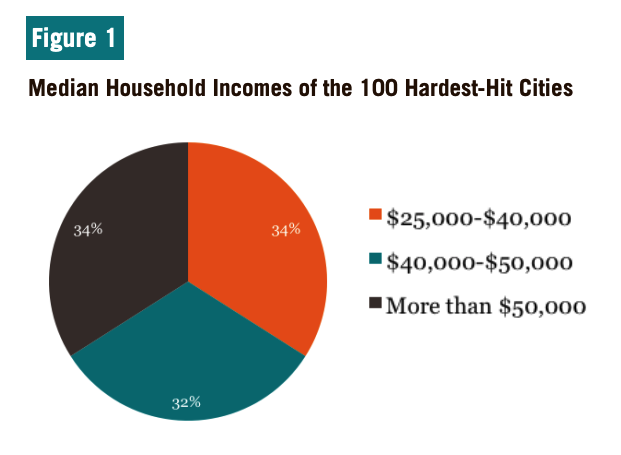
- In 66 of these cities the median household income is below $50,000 (the national median is $51,371).
- In 2013, more than 320,000 homeowners in these cities went into default or foreclosure.
- In the 395 hardest-hit ZIP codes with populations over 5,000, between 43 percent and 76 percent of homeowners are underwater.
- In almost two-thirds of these ZIP codes, African Americans and Latinos account for at least half of the residents.
- In 71 percent the median household income is below $50,000.
- In 2013, nearly 113,000 homeowners in these ZIP codes went into default or foreclosure.
- The eleven states with the highest number of hardest-hit ZIP codes are (in order): Georgia, Florida, Illinois, Michigan, Ohio, New Jersey, Maryland, Missouri, California, Nevada, and North Carolina.
RECOMMENDATIONS
The housing crisis is far from over for the families living in these hot spots. Despite a wide variety of federal initiatives and some voluntary programs, the crisis in hard-hit communities has not been resolved, primarily because one of the most effective tools—principal reduction to bring mortgages to their current market values—has been little utilized. We need bold intervention to make up for the shortcomings and inadequacies at the federal level.
Here are some key steps that should be taken immediately to address this crisis and ensure an equitable recovery for all homeowners:
- Loan holders—banks, government sponsored enterprises (i.e., Fannie Mae and Freddie Mac, which are regulated by the Federal Housing Finance Agency, FHFA), and investors—should reduce the principal on underwater mortgages to current market values.
- If loan holders are unwilling or unable to reduce the principal on underwater mortgages to current market values, they should allow these loans to be purchased by publicly-owned or nonprofit entities that are willing to restructure them with fair and affordable terms.
- Local municipalities should use all options at their disposal to facilitate the goal of resetting mortgages to current market values, including the use of “reverse eminent domain” (the program proposed in Richmond, California and elsewhere) to acquire mortgages in order to restructure them with fair and affordable terms.
- Banks, government sponsored enterprises like Fannie Mae and Freddie Mac, and investors that own vacant homes that have already been foreclosed upon should sell them to publiclyowned or nonprofit entities that can convert them to affordable housing units for residents of the community instead of selling them to speculators.
- Local municipalities should use all options at their disposal to facilitate the goal of turning vacant, foreclosed homes into affordable housing. This includes the use of “reverse eminent domain” to acquire properties in order to convert them to affordable housing units for residents of the community and to prevent them from being purchased by speculators.
INTRODUCTION
THE GREAT RECESSION—the worst economic crisis since the Great Depression—formally ended in June 2009, but the recovery has been extremely slow. Unemployment rates remained above 8 percent from February 2009 through August 2012, and did not drop below 7 percent until December 2013. Moreover, the number of people unemployed six months or longer has remained unprecedentedly high. Home prices did not bottom out until early 2012. Mortgage delinquencies and foreclosures did not start to diminish until 2012.
Now, foreclosures and mortgage delinquencies are down compared to the worst months of the crisis. Nationally, unemployment has dropped. But many places throughout the country have seen little improvement. Residents in those places are still living in recession conditions.
In fact, the overall “post-recession” narrative is misleading. Foreclosures and mortgage delinquencies may be down since the peak in 2009, but they have yet to return to pre-crisis levels (Orton 2013). For millions of families who have lost their homes to foreclosure, are currently behind on their mortgage payments, or remain underwater, the nightmare persists.
Many journalists and pundits tout the fact that housing prices are once again rising as evidence that the housing market is recovering. “Rising home prices rescue underwater homeowners,” proclaimed a headline in USA Today. (Schmit 2013). “The strength of the housing recovery is benefiting the distressed portion of the market, clearing it up more quickly,” claimed an article in Bloomberg (Gopal 2013). An op-ed column in the Los Angeles Times recommended “A free-market fix to the nation’s housing hangover,” (Gelinas 2011). These are all housing versions of the cliché that “a rising tide lifts all boats.”
This report documents that this celebration is premature and misleading. Many boats are not rising. They are UNDERWATER. They are more likely to drown than to be rescued by a rising tide. The so-called “recovery” has bypassed many parts of the country. In those places, housing prices are still dangerously below where they were when the housing bubble burst in 2007.
There are still many metropolitan areas, cities, and communities where a significant portion of homeowners owe more on their mortgages than their homes are worth. Not surprisingly, many of these places—which we call “HOT SPOTS”—have a significant proportion of African American and Latino families, since banks and other mortgage lenders had targeted communities of color with high-risk predatory loans during the peak years of the housing bubble. This report identifies the nation’s most troubled hot spots in order to draw attention to a serious problem that will not be fixed by waiting for market forces to save families from drowning.
This report examines the 15 metropolitan areas, 100 cities, and 395 ZIP codes with the worst “underwater” housing problem. These are the hot spots where housing prices have fallen the most, where the highest proportion of homeowners has “negative equity,” and where entire communities are at risk, fiscally and socially, because of these conditions. It is in these areas that public officials must act boldly before the disaster gets any worse.
THE UNDERWATER MORTGAGE CRISIS
“Underwater” homes are those where the homeowners have negative equity, which means they owe more on their mortgages than the market value of their homes. Underwater homeowners are 150 percent to 200 percent more likely to default on their mortgages than those with positive equity in their homes (Ocwen Financial 2011).
According to Zillow, more than 9.8 million American households, representing 19.4 percent of all mortgaged homes, were still underwater on their mortgages as of December 31, 2013 (Gudell 2014). Zillow looks at current outstanding loan amounts for individual owner-occupied homes and compares them to those homes’ current estimated values.1
Depressed home prices combined with the most severe recession since the 1930s caused millions of families to lose their homes, and millions more are still at risk of foreclosure because they owe far more on their mortgages than what their homes are worth. Furthermore, many of these homeowners are locked into predatory “adjustable rate” loans with interest rates that will jump up, putting them at even greater risk of eventually defaulting on their mortgages.
From September 2008 through the end of 2013, approximately 4.9 million families lost their homes to foreclosure. Between 2010 and 2013, another 1.3 million families lost their homes to short sales. American households lost an estimated $7 trillion in household wealth between 2006 and 2011 as a result of the housing crisis (Federal Reserve 2012). In 2012 the national homeownership rate fell for the eighth year in a row (Joint Center for Housing Studies 2013: 3).
In 2011, 31 percent of all homeowners (23.6 million owner households) were cost-burdened—they paid more than 30 percent of their income for housing. Among those, 13.6 percent of homeowners (9.3 million) were severely cost-burdened, paying more than 50 percent of their income for housing (U.S. Department of Housing and Urban Development 2013). All of these families are hanging by a thread and remain vulnerable to default and foreclosure.
Although recent increases in home prices have reduced the ranks of underwater homeowners over the past year, there is little likelihood that market forces, on their own, will solve the problem. The idea that all these families need to do is wait for the housing recovery to come to their city or neighborhood is a false premise. More direct action must be taken.
RISING HOME PRICES
Nationally, after adjusting for differences in home size and quality, housing prices increased by 103 percent from March 2000 to their peak in July 2006. Once the housing bubble burst, one year later, home prices plummeted and did not show any sign of recovery until mid-2012. Not since the Great Depression did home prices fall so dramatically. At their lowest point, in March 2012, prices had declined by 35 percent from their peak levels. Prices have recovered somewhat since then, but as of January 2014, the most recent date for which data are available, they were still 20 percent below their peak levels (S&P/Case-Shiller Home Price Indexes 2014).
The total value of owner-occupied housing in the U.S. decreased from $22.6 trillion in 2006 to $15.9 trillion in 2011, a drop of $6.7 trillion. As of 2013 the total value had rebounded to $19.4 trillion, but it is still $3.2 trillion below the 2006 level.
Equally important, the rise in home prices that has been occurring recently is expected to slow down dramatically in 2014. Clear Capital forecasts that home prices nationally will rise by only 3.4 percent in 2014, about the historical average (Clear Capital 2014). Kiplinger’s Personal Finance expects an increase of 4 percent. (Esswein 2014)
These are the national trends. In many local areas, the downturn was more severe and the recovery has either been far slower or hollow, including metro areas as varied as Detroit, Miami, Las Vegas, Atlanta, and Chicago (S&P/Case-Shiller Home Price Indexes 2013). As the so-called recovery slows in 2014, these hot spots are not likely to see their fortunes change in the near future.
Furthermore, in some of these metro areas, cities, and ZIP codes, housing prices may have risen, but not primarily as a result of market forces, as that concept is traditionally understood. That is, it is not a matter of individual homebuyers re-entering the market and engaging in voluntary exchanges with willing sellers, resulting in higher prices commensurate with the growing demand. Instead, large investment firms and hedge funds have been purchasing properties in the hardest-hit areas in large quantities, often at fire-sale prices, pushing up home prices in those markets. The largest private equity firm in the world, the Blackstone Group, is now the nation’s largest owner of single-family rental homes. It bought 1,400 houses in Atlanta in a single day.
These practices may have artificially boosted home prices, but they have also made local housing markets even more volatile. The investors are making a large profit renting the properties, but continuing to drain wealth from these communities (Gottesdiener 2013; Gittelsohn and Perlberg 2013). As prices rise, ordinary buyers have been priced out of the market. Consequently, demand and prices have increased in rental units, particularly in the nation’s hardest-hit communities.
PREDATORY LENDING, RACIAL DISCRIMINATION, AND LOST WEALTH
These losses in housing are not randomly distributed across the population. There are geographic hot spots where the problem is particularly dire. Many of these hot spots are areas with a significant population of African American and Latino homeowners who were targets of abusive and reckless banking practices, including an epidemic of subprime loans with predatory features. Banks, private mortgage companies, and mortgage brokers preyed on homeowners in low-income and minority areas. They did not just target low-income African American and Latino families; they also targeted middle-class African American and Latino families who lived in neighborhoods with high proportions of minority families.
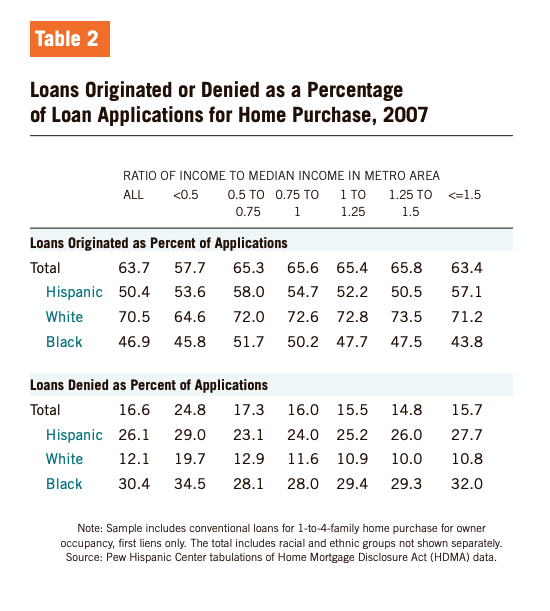
As TABLE 2 reveals, at the height of the housing bubble in 2007, African Americans and Latinos were much more likely to be rejected for conventional mortgage loans than whites. These differences cannot be explained by income differences among the racial groups. African Americans and Latinos with similar incomes as whites were nevertheless rejected for conventional loans at a much higher rate.2
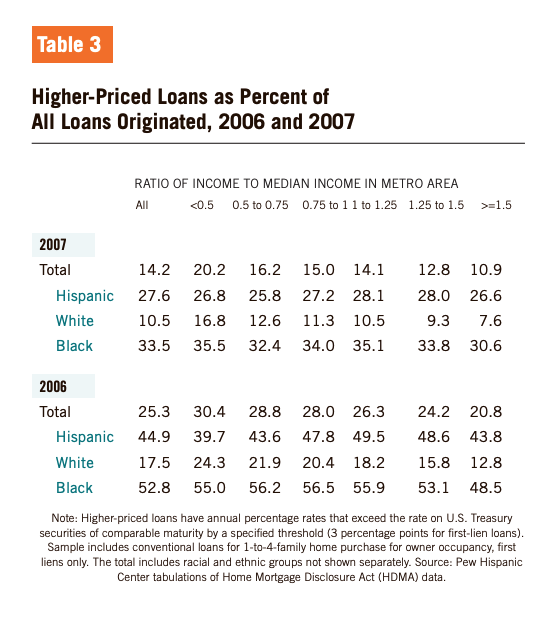
As TABLE 3 reveals, African Americans and Latinos were also much more likely to receive high-priced (subprime) loans. These differences, too, cannot be explained by the fact that, overall, whites have higher incomes than African Americans and Latinos because African Americans and Latinos with similar incomes as whites were much more likely to have subprime loans.3 This pattern suggests that lenders often rejected African American and Latino consumers for conventional mortgages at a much higher rate than they rejected white consumers, even when they were eligible for conventional loans. Once this occurred, lenders often steered many Africans Americans and Latinos into taking subprime mortgages (Kochar, Gonzalez-Barrera, and Dockterman 2009).
These patterns and practices occurred in cities across the country and were carried out by a wide variety of lenders. In 2012, for example, the U.S. Department of Justice reached a $175 million settlement with Wells Fargo over its discriminatory lending practices. That settlement set aside $125 million in compensation to African American and Latino borrowers whom the lender had steered into subprime mortgages or to whom it had charged higher fees and interest rates than comparable white borrowers, and $50 million for down payment assistance to borrowers in communities where the Department identified large numbers of discrimination victims. Among the evidence cited in this case were statements by Wells Fargo loan officers who referred to subprime loans as “ghetto loans” for “mud people.” (U.S. Department of Justice 2012; Relman 2013.)
Between 2005 and 2009, overall wealth among African Americans and Latinos declined by 53 percent and 66 percent, respectively, compared to 16 percent for whites (Kochar, Fry, and Taylor 2011). Among the vast majority of Americans, and particularly for people of color, their homes are their biggest asset and the largest source of wealth. Homeownership constitutes 92 percent of the net worth for African Americans and 67 percent for Latinos, compared to 58 percent for whites (Tippet et al. 2014: 4). The disparities in foreclosure rates among home loan borrowers between 2004 and 2008 – 11 percent for African Americans,14 percent for Latinos, and 6 percent for whites (Bocian et al. 2012)– therefore likely helped contribute to this discrepancy in wealth loss.
THE HOT SPOTS
THIS REPORT DOCUMENTS where the most serious housing crises persist. It identifies those metropolitan areas, cities, and ZIP codes that face the most extreme levels of lost equity, where the most underwater homes are located, and where families are most acutely vulnerable to foreclosure. In brief, below are the hot spots that are under the greatest stress.
HARDEST-HIT METROPOLITAN AREAS
We first examined the 15 hardest-hit major metropolitan areas with populations over one million. The 15 metropolitan areas span across 16 states. In these 15 areas—Las Vegas, Atlanta, Jacksonville, Orlando, Chicago, Tampa, Detroit, Miami, Memphis, Virginia Beach, Riverside, Kansas City, St. Louis, Cleveland, Milwaukee—between 23 percent and 35 percent of homeowners have negative equity (see TABLE 4). In these troubled metropolitan areas, home prices remain up to 45 percent below their peak levels.
HARDEST-HIT CITIES
In the 100 hardest-hit cities (those with populations over 100,000), between 22 percent and 56 percent of homeowners have negative equity.
A full 57 of these cites still have at least 30 percent of mortgaged homes UNDERWATER.
Almost one in ten Americans (28.7 million) lives in these 100 cities. There are more than 320,000 homes in these cities that went into default or foreclosure in 2013. Home prices in these cities remain up to 57 percent below their peak levels. In eight of these cities, home prices are still more than 50 percent below their peak levels. In another 23 cities, home prices are between 40 percent and 49 percent below their peak. In other words, in 31 out of the 100 hardest-hit cities, home prices are still at least 40 percent below their peak levels.
TABLE 5 lists the 10 hardest-hit cities in the U.S. with populations over 100,000. Appendix B has the full list of the top 100 hardest-hit cities.
The 100 hardest-hit cities are located in 27 states, but some states have more troubled cities than others. Eighteen cities in California—Richmond, Sacramento, Stockton, Vallejo, Antioch, Victorville, Lancaster, San Bernardino, Palmdale, Visalia, Fresno, Moreno Valley, Modesto, Fairfield, Bakersfield, Rialto, Fontana, and Salinas—are among the nation’s 100 hardest-hit cities. Sixteen cities in Florida are among the 100 hardest-hit. These are Miami Gardens, Palm Bay, Jacksonville, Port Saint Lucie, Hialeah, Miramar, Orlando, Tampa, Brandon, Tallahassee, Gainesville, Saint Petersburg, Miami, Pompano Beach, Clearwater, and Fort Lauderdale. Ohio has six of the nation’s hardest-hit cities. Five cities in both Illinois and Arizona rank among the nation’s underwater hot spots.
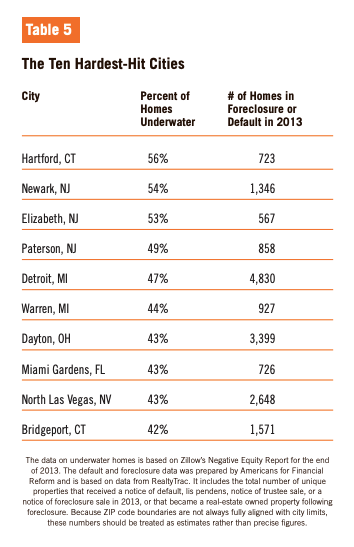
The overwhelming majority of these cities are lower-income communities, with median household incomes below the national median of $51,371. In fact, as FIGURE 1 illustrates, two-thirds of the 100 hardest-hit cities have median incomes below $50,000, and 34 percent have median incomes below $40,000. The hardest-hit city of all, Hartford, CT, is also one of the poorest, with a median household income of just $28,931. The so-called recovery has left behind lower-income communities.
What also distinguishes the 100 hardest-hit cities is that almost all of them have African American and Latino populations that are significantly higher than their representation in the nation as a whole or in their metropolitan areas. As FIGURE 2 shows, in 14 of the 100 hardest-hit cities, African Americans and Latinos comprise more than 75 percent of population. In another 38 cities, these two groups comprise between 50 percent and 75 percent of the city populations. In another 19 cities, they make up between 40 percent and 50 percent of city populations. In other words, in 71 of the 100 hardest-hit cities, African Americans and Latinos account for at least 40 percent of the residents. This is not surprising because—as noted earlier—banks and mortgage brokers targeted African American and Latino neighborhoods, homebuyers, and mortgage consumers with predatory and subprime mortgages.
Even in those hard-hit cities with the highest median household incomes, African Americans and Latinos comprise a significant proportion of the city population. In Chesapeake, VA, with a median household income of $70,244, African Americans and Latinos account for 36 percent of residents. In Fairfield, CA ($66,363), these two groups comprise 44 percent of the population. In Henderson, NV, a suburb of Las Vegas with a median household income of $66,141, they constitute 21 percent of residents. In Antioch, CA ($65,494), 53 percent of residents are African American and Latino. In Fontana, CA ($64,195), 78 percent of residents fit that description. African Americans and Latinos account for 84 percent of the population of Miramar, Florida, whose median household income of $63,898 is substantially higher than the national figure.
HARDEST-HIT ZIP CODES
Within every city, however, some neighborhoods are worse than others and many have been particularly hard-hit by the housing crash and not lifted up by the broader recent trend of rising home prices. These communities were the most devastated victims of Wall Street’s predatory and subprime lending practices. They are now among the worst hot spots in terms of the proportion of families who are underwater and unlikely to survive without assistance.
To identify the hardest-hit neighborhoods, we examined the 500 ZIP codes with the highest percentage of homes with negative equity. There are 29,762 general ZIP codes in the entire country. ZIP codes vary in size from a handful of residents to more than 100,000 residents. The average population size is roughly 7,500. To remove ZIP codes that are in primarily commercial areas, we eliminated the ZIP codes with fewer than 5,000 residents. That left 395 residential ZIP codes with the highest percentage of homes with negative equity. These 395 ZIP codes are home to more than 10.4 million people.
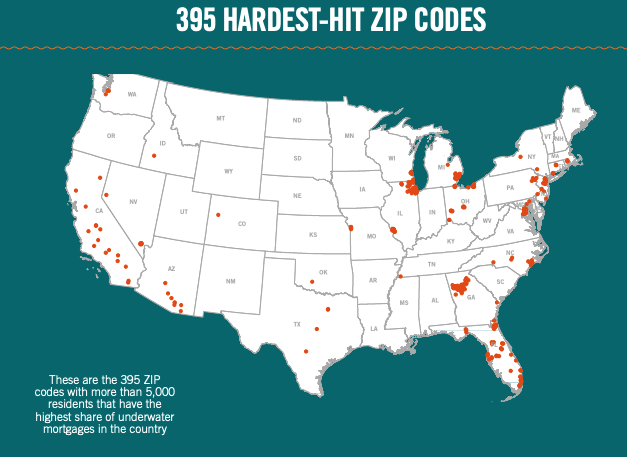
In the 395 hardest-hit ZIP codes, between 43 percent and 76 percent of homeowners have negative equity. Home prices in these 395 ZIP codes remain up to 66 percent below their peak levels. Among these 395 ZIP codes, the median decline of home prices is 41 percent. There nearly 113,000 homes in just these 395 ZIP codes that went into default or foreclosure in 2013. Appendix C contains the full list of the 395 hardest-hit ZIP codes.
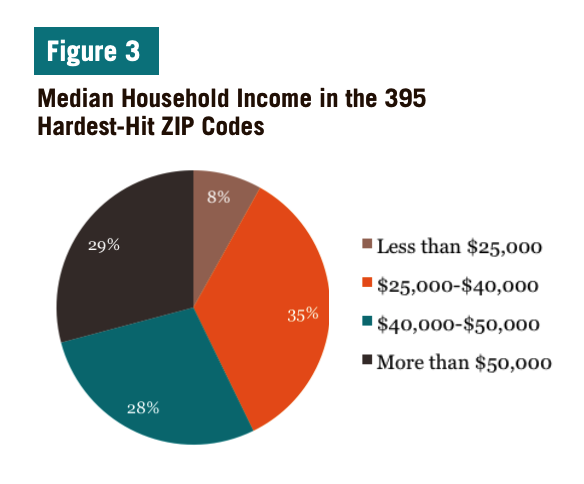
The median household incomes of the 395 hardest-hit ZIP codes range from $9,895 (ZIP code 43604 in Toledo, OH) to $118,622 (ZIP code 20607 in Accokeek, Maryland near Washington, DC), but the vast majority of hardest-hit ZIP codes have median household incomes significantly below the national figure of $51,371. As FIGURE 3 shows, 32 (8 percent) of the 395 ZIP codes had median household incomes below $25,000. Another 137 (35 percent) ZIP codes had median household incomes between $25,000 and $40,000. Another 111 (28 percent) ZIP codes had median household incomes between $40,000 and $50,000.4 In total, 71 percent of the hardest–hit ZIP codes had median household incomes below $50,000.
Again, not surprisingly, what distinguishes the 395 hardest-hit ZIP codes is that almost all of them have African American and Latino populations significantly higher than their representation in the nation as a whole or in their metropolitan areas. They represent an even higher proportion of residents than that in the hardest-hit 100 cities.
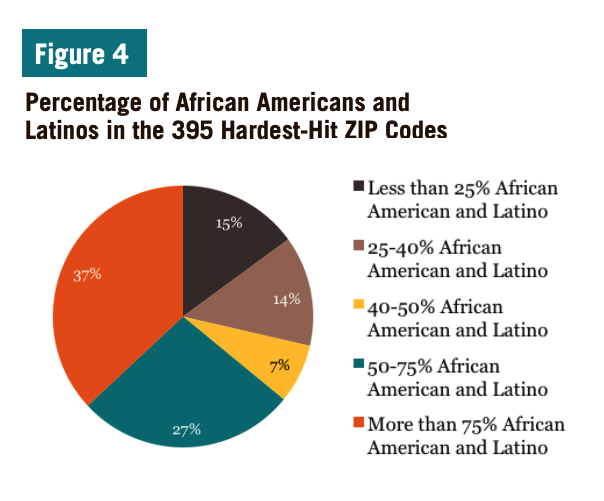
As FIGURE 4 shows, in 146 of the 395 hardest-hit ZIP codes, African Americans and Latinos comprise more than 75 percent of the population. In another 107 ZIP codes, these two groups comprise between 50 percent and 75 percent of the populations. In other words, in almost two-thirds (64 percent) of the 395 hardest-hit ZIP codes, African Americans and Latinos account for at least half of the residents. Once again we see the severe consequences of the banking industry’s predatory practices of targeting African American and Latino neighborhoods, homebuyers, and mortgage consumers.
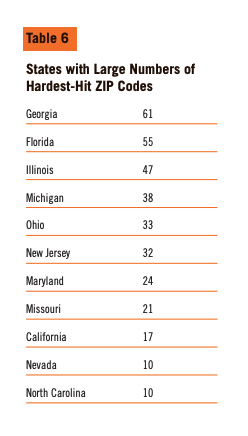
The 395 hardest-hit ZIP codes are found in 23 states. They are not all located in central cities. Quite a few are found in suburbs and in small towns in rural areas. TABLE 6 shows the states with particularly high numbers of hardest-hit ZIP codes.
These 395 hardest-hit ZIP codes, however, are just the tip of the iceberg. There are thousands of neighborhoods in hundreds of cities that have been devastated by the housing crash and have no prospects of significant improvement. It is in these neighborhoods that the epidemic of foreclosures and the tide of underwater mortgages have had the worst impact. These are just some of the nation’s hot spots that continue to suffer in the wake of the recession and ongoing housing problems in the U.S. These findings reveal that these crises are hardly over. Market forces and federal initiatives are clearly not solving the problems. Local actors are understandably trying to address what the federal government and other forces have been unable to resolve. The findings, unfortunately, demonstrate why such local actions are necessary.
- 1Zillow is the only data source that uses current outstanding loan balances on all mortgages when calculating negative equity. Other reports estimate current outstanding loan balance based on the most recent loan on a property (i.e., the original loan amount at time of purchase or refinance).
- 2Tables 2 and 3 are based on data from Rakesh Kochar, Ana Gonzalez-Barrera, and Daniel Dockterman. 2009. “Loans for Home Purchase in 2007.” Washington. D.C.: Pew Research Center, May 12. http://www. pewhispanic.org/2009/05/12/iv-loans-for-home-purchase-in-2007
- 3Some have argued that the reason that African Americans and Latinos were more likely than whites to be rejected for conventional loans is that they were less credit worthy than whites, even those with comparable incomes. However the Federal Reserve Bank of Boston conducted a study of mortgage lending that took credit-worthiness into account and concluded that lenders practiced racial discrimination even when credit worthiness was comparable. Munnell (1996), Ards (2001) and Carr (1993).
- 4We could not identify the median household incomes for two of the ZIP codes.